


Gold Technical Price Outlook: XAU/USD Near-term Trade Levels
- Gold price updated technical trade levels – Daily & Intraday Charts
- XAU/USD coils into downtrend resistance- bearish invalidation at 1935
- New to Gold Trading? Get started with this Free How to Trade Gold -Beginners Guide
Gold prices are poised to snap a two-week winning streak with XAU/USD down more than 1.6% since the start of the week. The decline takes price into monthly open support and the focus is on a break of the weekly range for guidance. These are the updated targets and invalidation levels that matter on the XAU/USD technical charts heading into the start of the week. Review my latest Strategy Webinar for an in-depth breakdown of this gold technical setup and more.
Gold Price Chart - XAU/USD Daily
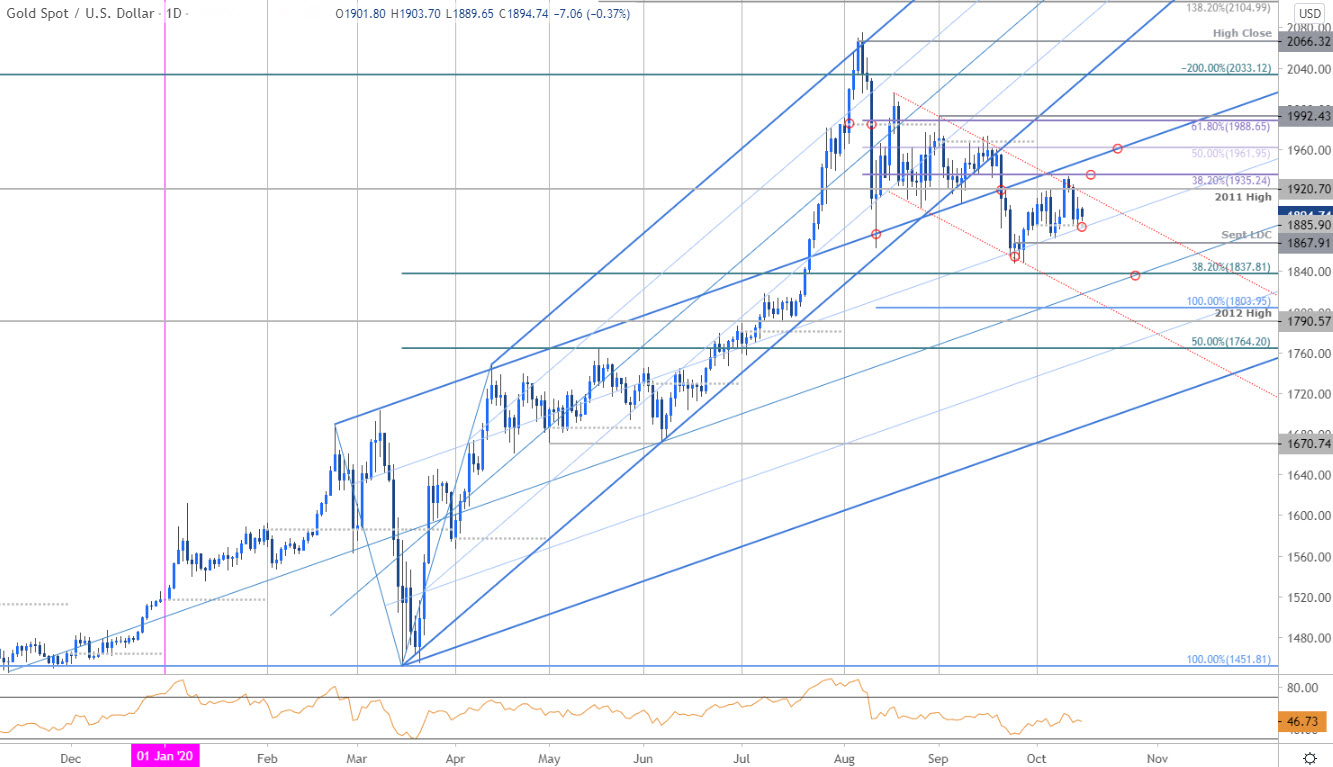
Chart Prepared by Michael Boutros, Technical Strategist; Gold on Tradingview
Technical Outlook: In my last Gold Price Outlook we highlighted that the XAU/USD, “rebound may be vulnerable as the recovery approaches confluence downtrend resistance just higher- be on the lookout for possible topside exhaustion ahead of 1935 IF price is indeed heading lower.” Gold registered a high at 1933 into the start of the week before reversing lower with the decline rebounding off monthly open support this week at 1884.
Daily resistance stands at the 2011 high / October high-day close at 1920/22 with a breach / close above 1935 needed to mark resumption towards 1961 and critical resistance at 1989/92. A break / close below the September low-day close at 1867 would suggest a deeper correction is underway with such a scenario exposing the 38.2% Fibonacci retracement at 1837.
Gold Price Chart - XAU/USD 120min
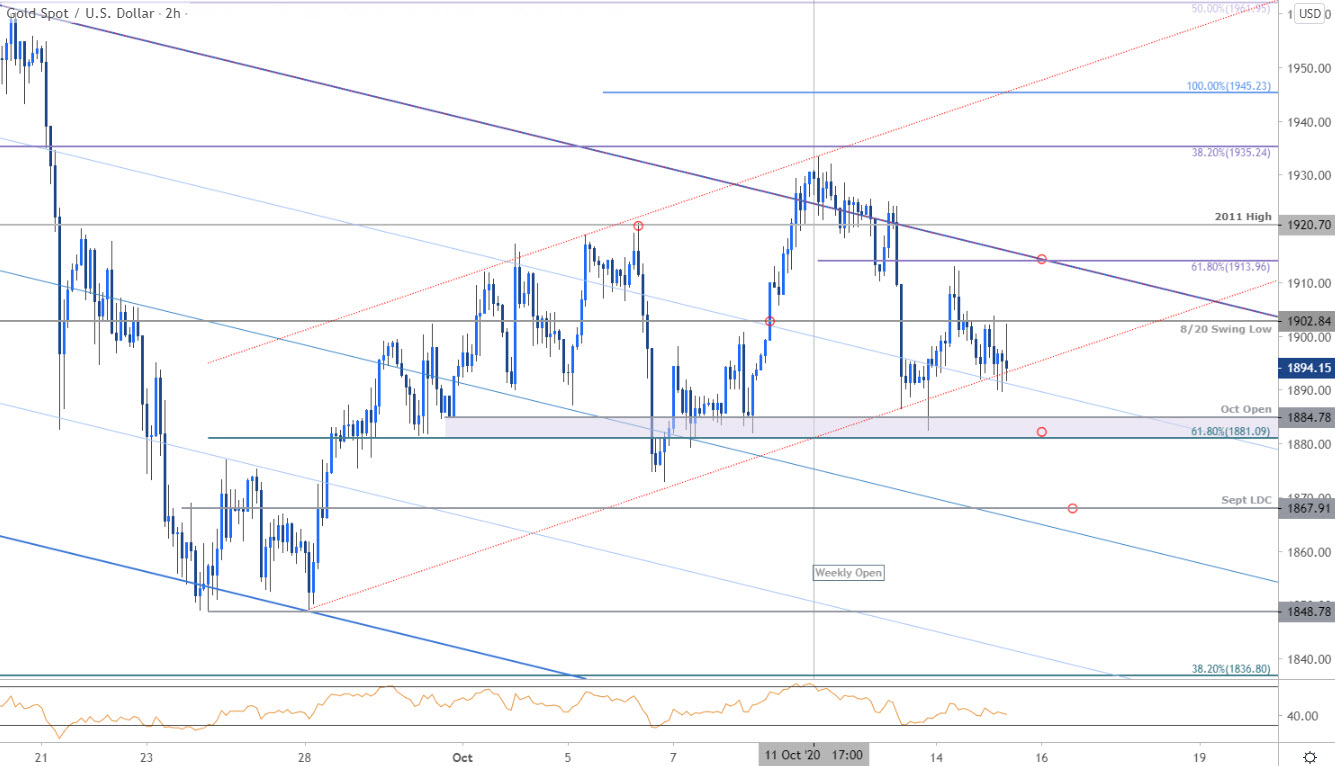
Notes: A closer look at Gold price action sees XAU/USD trading within the confines a descending pitchfork formation extending off the late-August decline with and embedded channel governing the recent advance. Key near-term support steady at 1881/84 with a close below 1867 needed fuel the next leg lower in price. Initial resistance stands at the 8/20 swing low at 1902 backed by the 61.8% retracement / upper parallel at 1913- looking for topside exhaustion ahead of this zone IF price is heading lower. Ultimately a breach above 1920/22 would be needed to mark resumption of the broader uptrend.

Bottom line: Gold prices are consolidating within the October opening-range just below multi-month downtrend resistance. From a trading standpoint, the immediate focus is on a break of the 1881-1913 range for guidance with the broader risk weighted to the downside sub-1922. Ultimately, a larger correction may offer more favorable opportunities closer to uptrend support with a breach above the monthly highs needed to mark resumption. Review my latest Gold Weekly Price Outlook for a closer look at the longer-term XAU/USD technical trading levels.
For a complete breakdown of Michael’s trading strategy, review his Foundations of Technical Analysis series on Building a Trading Strategy
Gold Trader Sentiment – XAU/USD Price Chart

- A summary of IG Client Sentiment shows traders are net-long Gold- the ratio stands at +4.41 (81.5% of traders are long) – bearishreading
- Long positions are5.46% lower than yesterday and 0.92% higher from last week
- Short positions are 3.71% higher than yesterday and 15.35% lower from last week
- We typically take a contrarian view to crowd sentiment, and the fact traders are net-long suggests Gold prices may continue to fall. Yet traders are less net-long than yesterday but more net-long from last week and the combination of current positioning and recent changes gives us a further mixed Gold trading bias from a sentiment standpoint.
| Change in | Longs | Shorts | OI |
| Daily | 1% | -3% | -1% |
| Weekly | 2% | -8% | -2% |
---
Active Technical Setups
- Euro Dollar Technical Outlook: EUR/USD Defends Monthly Open Support
- Canadian Dollar Outlook: USD/CAD Breakdown Stalls
- Dollar vs Mexican Peso Outlook: USD/MXN Plummets to Key Support Zone
- Australian Dollar Forecast: AUD/USD Breakout Pending- Aussie Setup
- Written by Michael Boutros, Technical Strategist with DailyFX
Follow Michael on Twitter @MBForex


