


Gold Technical Price Outlook: XAU/USD Near-term Trade Levels
- Gold price updated technical trade levels – Daily & Intraday Charts
- XAU/USD recovery approaching confluence downtrend resistance- bearish invalidation at 1935
- New to Gold Trading? Get started with this Free How to Trade Gold -Beginners Guide
Gold prices are poised to mark an outside-day reversal into multi-day highs early in the week with gold up more 3.7% off the late-September lows. The advance may be vulnerable in the days ahead however as XAU/USD approaches multi-month downtrend resistance. These are the updated targets and invalidation levels that matter on the XAU/USD technical charts heading into the start of the week. Review my latest Strategy Webinar for an in-depth breakdown of this gold technical setup and more.
Gold Price Chart - XAU/USD Daily
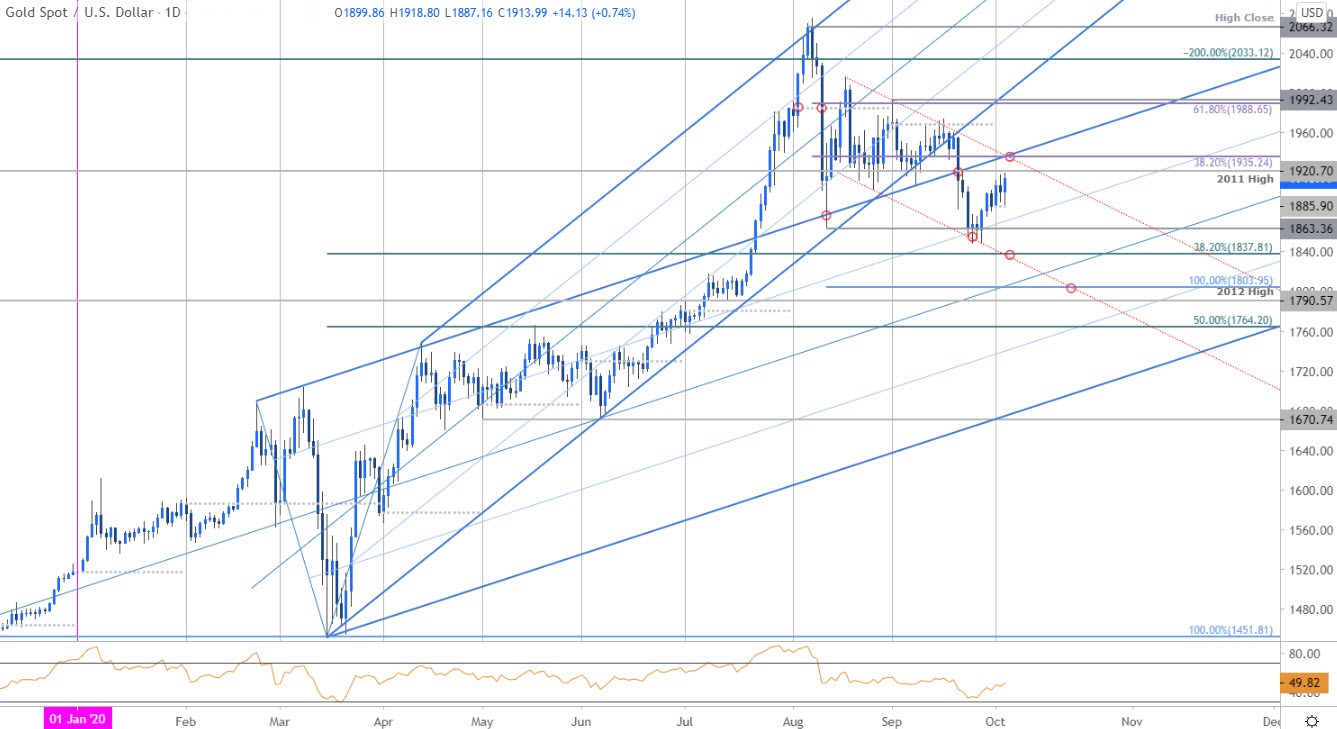
Chart Prepared by Michael Boutros, Technical Strategist; Gold on Tradingview
Technical Outlook: In my last Gold Price Outlook we highlighted that the XAU/USD, “price rebound remains constructive while within this near-term formation but the broader outlook remains tilted to the downside within the August decline.” Gold has continued to hold this near-term ascent heading into the first full week of October trade with the advance now approaching more significant technical downtrend resistance.
Initial daily resistance stands at the 2011 high at 1920 backed closely by the upper parallels / 38.2% Fibonacci retracement at 1935- risk for topside exhaustion while below this threshold. Monthly open support rests at 1886 with a break below the August low at 1863 needed to suggest a deeper correction is underway towards 1837 and the 100% extension at 1803.
Gold Price Chart - XAU/USD 120min

Notes: A closer look at Gold price action sees the XAU/USD recovery trading within the confines of an embedded near-term ascending channel formation with resistance objectives eyed just higher. Be on the lookout for pivot on a stretch higher with a close above 1935 needed to keep the long-bias viable. Initial support at 1885 backed by 1880/82 – look for a reaction there with a break below shifting the focus lower again.

Bottom line: The gold price rebound may be vulnerable as the recovery approaches confluence downtrend resistance just higher- and outside day-reversal into the highs today also highlights this risk. From at trading standpoint, look to reduce long-exposure / raise protective stops on a test of the upper parallel – be on the lookout for possible topside exhaustion ahead of 1935 IF price is indeed heading lower with a break below 1880 needed to fuel the next leg down. Ultimately, a breach / close above this formation is needed to suggest a larger reversal is underway towards critical resistance at 1988/92. Review my latest Gold Weekly Price Outlook for a closer look at the longer-term XAU/USD technical trading levels.
For a complete breakdown of Michael’s trading strategy, review his Foundations of Technical Analysis series on Building a Trading Strategy
Gold Trader Sentiment – XAU/USD Price Chart

- A summary of IG Client Sentiment shows traders are net-long Gold- the ratio stands at +3.50 (77.8% of traders are long) – bearishreading
- Long positions are2.67% lower than yesterday and 7.29% lower from last week
- Short positions are 17.96% higher than yesterday and 14.90% higher from last week
- We typically take a contrarian view to crowd sentiment, and the fact traders are net-long suggests Gold prices may continue to fall. Yet traders are less net-long than yesterday and compared with last week. Recent changes in sentiment warn that the current Gold price trend may soon reverse higher despite the fact traders remain net-long.
| Change in | Longs | Shorts | OI |
| Daily | 0% | -1% | -1% |
| Weekly | 7% | -10% | -2% |
---
Active Technical Setups
- Euro Dollar Outlook: EUR/USD Bounce Faces First Test- NFP Levels
- Dollar vs Mexican Peso Outlook: USD/MXN Breakout Pending
- Oil Price Outlook: Crude Caught at Resistance- WTI Breakout Pending
- S&P 500 Technical Outlook: Bears Challenge First Major Support
- Canadian Dollar Outlook: USD/CAD Breakout Levels- Bull’s First Test
- Australian Dollar Forecast: AUD/USD Plummets, Can Bulls Back the Bid?
- Written by Michael Boutros, Technical Strategist with DailyFX
Follow Michael on Twitter @MBForex


