


Canadian Dollar Technical Price Outlook: Near-term Trade Levels
- Canadian Dollar updated technical trade levels – Daily & Intraday Charts
- USD/CAD multi-week sell-off vulnerable off downtrend support
- Resistance 1.3162, bearish invalidation 1.3222 – critical support 1.3046/56
The Canadian Dollar is fractionally softer against the US Dollar since the start of the week with USD/CAD setting a well-defined weekly opening range at fresh monthly lows. The recent sell-off is showing signs of exhaustion however and while the outlook remains tilted to the downside, the immediate decline may be vulnerable near-term. These are the updated targets and invalidation levels that matter on the USD/CAD price charts. Review my latest Strategy Webinar for an in-depth breakdown of this Loonie technical setup and more.
Canadian Dollar Price Chart – USD/CAD Daily
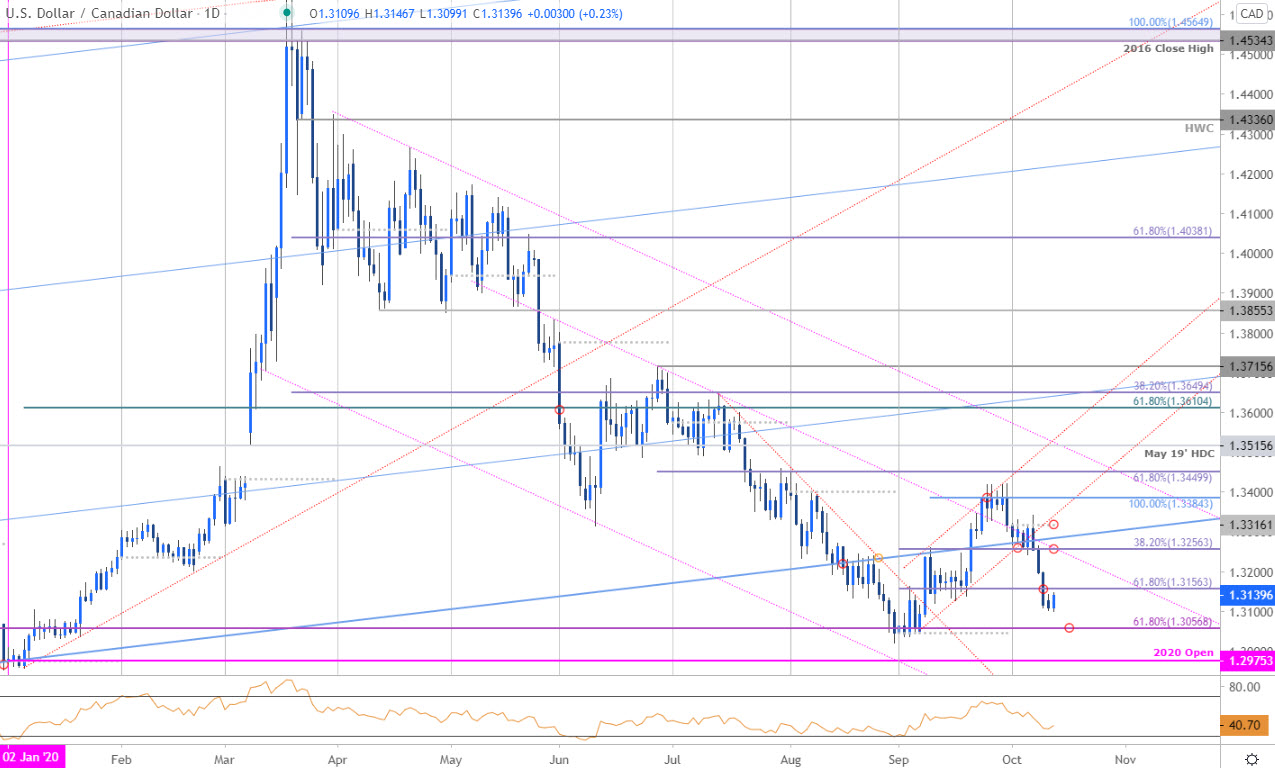
Chart Prepared by Michael Boutros, Technical Strategist; USD/CAD on Tradingview
Technical Outlook: In my last Canadian Dollar Price Outlook we noted that USD/CAD was, “testing a key inflection zone at confluence uptrend support. . . Be on the lookout for topside exhaustion ahead of 1.3316 on rallies IF price is indeed heading lower.” The zone in focus was 1.3256 – a region defined by channel support and the 38.2% retracement of the September rally. A recovery off this threshold early in the month briefly registered a high at 1.3340 before reversing sharply lower.
A four-day decline has stalled at fresh monthly lows with price threatening an outside-day reversal today in New York. Daily resistance stands at 1.3156 backed by 1.3256- bearish invalidation now lowered to the monthly open at 1.3316. Key daily support remains with the 61.8% Fibonacci retracement of the 2017 rally at 1.3056- look for a more significant reaction there IF reached.
Canadian Dollar Price Chart – USD/CAD 120min

Notes: A closer look at Loonie price action shows USD/CAD trading within the confines a descending pitchfork formation with the recent sell-off responding to the lower parallel early in the week. A clean weekly opening-range is being tested today with the immediate focus on a break of the 1.3085-1.3162 range for guidance.
A topside breach / close above the 1.3156/62 resistance zone exposes 1.3206 backed by 1.3222- both regions of interest for possible topside exhaustion IF reached. Initial support at 1.3085 backed by critical support at the September open / 161.8% ext / 61.8% retracement at 1.3046/56- a break / close below this threshold would be needed to fuel the next leg lower in price towards the yearly open at 1.2975.

Bottom line: USD/CAD is now testing near-term downtrend support with a weekly opening-range taking shape just above the lower parallel. From a trading standpoint, look for topside exhaustion ahead of 1.3221 on recoveries IF price is indeed heading lower with critical support steady at 1.3046/56. Ultimately, we’re looking for basing this week with a breach above this formation needed to shift the focus higher again in the US Dollar. Review my latest Canadian Dollar Weekly Price Outlook for a closer look at the longer-term USD/CAD technical trade levels.
For a complete breakdown of Michael’s trading strategy, review his Foundations of Technical Analysis series on Building a Trading Strategy
Canadian Dollar Trader Sentiment – USD/CAD Price Chart
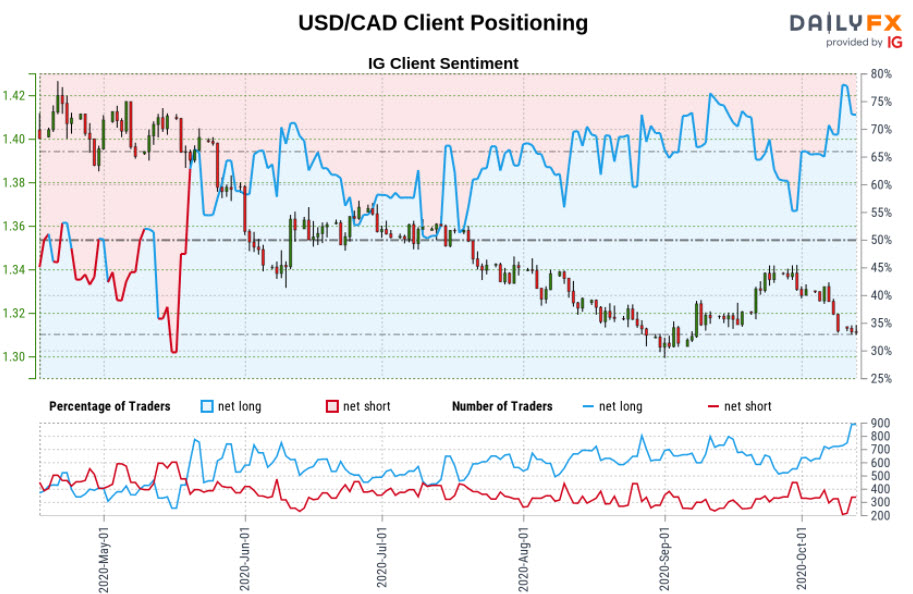
- A summary of IG Client Sentiment shows traders are net-long USD/CAD - the ratio stands at +2.82 (73.85% of traders are long) – bearish reading
- Long positions are4.06% higher than yesterday and 12.25% higher from last week
- Short positions are 25.20% higher than yesterday and 23.92% lower from last week
- We typically take a contrarian view to crowd sentiment, and the fact traders are net-long suggests USD/CAD prices may continue to fall. Traders are less net-long than yesterday but more net-long from last week. The combination of current positioning and recent changes gives us a further mixed USD/CAD trading bias from a sentiment standpoint.
| Change in | Longs | Shorts | OI |
| Daily | -2% | 7% | 5% |
| Weekly | -30% | 38% | 13% |
---
Key US / Canada Data Releases
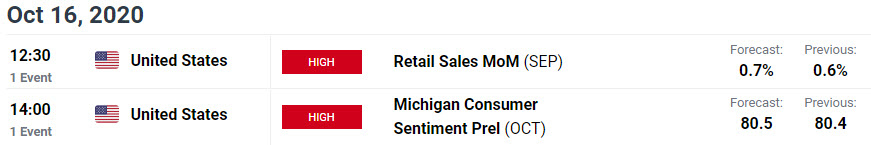
Economic Calendar - latest economic developments and upcoming event risk.
Active Technical Setups
- Dollar vs Mexican Peso Outlook: USD/MXN Plummets to Key Support Zone
- Australian Dollar Forecast: AUD/USD Breakout Pending- Aussie Setup
- Gold Price Outlook: Can XAU/USD Break Critical Resistance? GLD Levels
- Euro Dollar Outlook: EUR/USD Bounce Faces First Test- NFP Levels
- Oil Price Outlook: Crude Caught at Resistance- WTI Breakout Pending
- Written by Michael Boutros, Currency Strategist with DailyFX
Follow Michael on Twitter @MBForex


