


Gold Technical Price Outlook: XAU/USD Near-term Trade Levels
- Gold price updated technical trade levels – Daily & Intraday Charts
- XAU/USD sell-off approaching uptrend support- risk for further losses sub-1731
- New to Gold Trading? Get started with this Free How to Trade Gold -Beginners Guide
Gold prices are down more than 1% heading into the Wednesday open in New York with XAU/USD now off more than 3% from the May / yearly highs. The decline is approaching multi-week uptrend resistance and the focus is on a reaction just lower. These are the updated targets and invalidation levels that matter on the XAU/USD technical charts in the days ahead. Review my latest Weekly Strategy Webinar for an in-depth breakdown of this gold trade setup and more.
Gold Price Chart - XAU/USD Daily
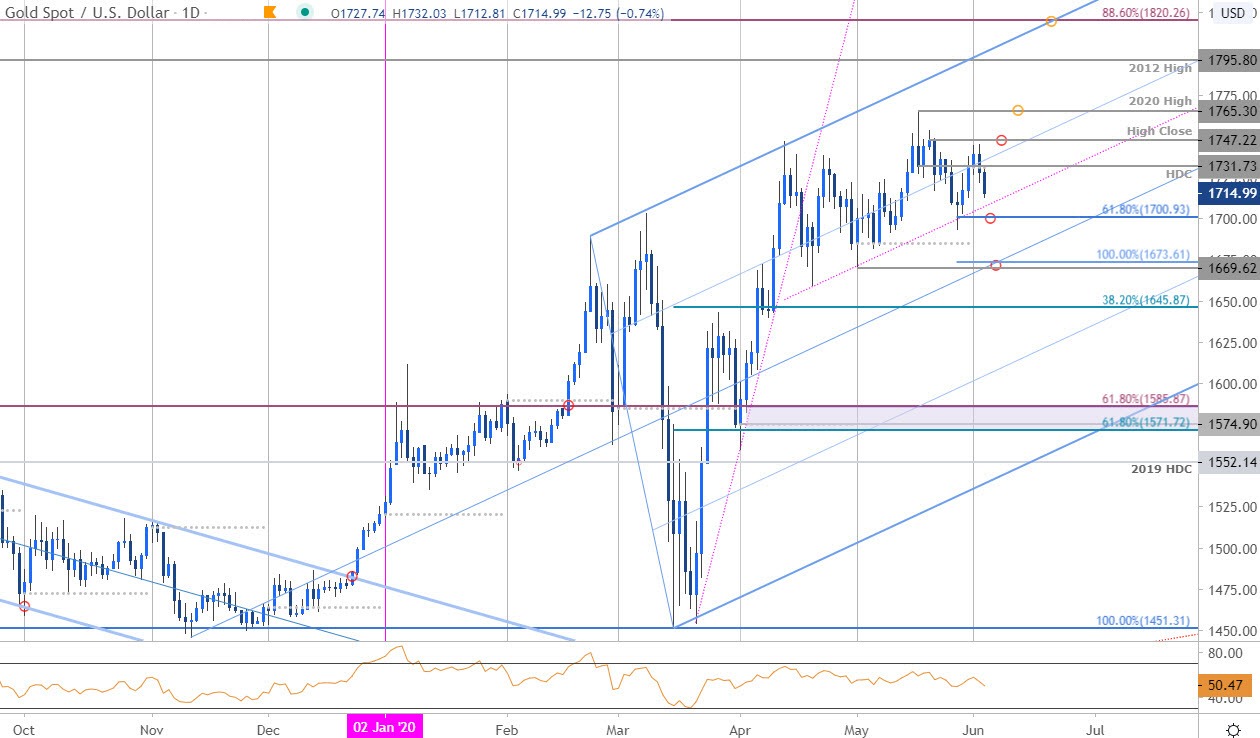
Chart Prepared by Michael Boutros, Technical Strategist; Gold on Tradingview
Technical Outlook: In last month’s Gold Price Outlook we noted that XAU/USD was, “in correction off the monthly / yearly high with the pullback now approaching initial levels of up-trend support.” The focus was on an exhaustion low on a test of the 1690s zone – price registered a low at 1692 before rallying into the close of May trade. Yesterday, price failed just ahead of the yearly high-close at 1747 before pulling back with gold posting an outside-day reversal off the highs.
The sell-off is now approaching parallel support (magenta) backed closely by the 61.8% Fibonacci ext of the decline off the yearly highs at 1700- a close below this threshold is needed to keep the short-bias viable with such a scenario exposing a more significant support confluence at 1669/73. Daily resistance at the 2020 high-day close at 1731 backed by near-term bearish invalidation at the yearly high-close at 1747- a breach / close above this threshold is needed to mark resumption of the broader uptrend.
Gold Price Chart - XAU/USD 120min

Notes: A closer look at Gold price action sees XAU/USD trading within the confines of an ascending pitchfork formation extending off the late-April lows with the recent decline now probing the 61.8% retracement at 1713. Next key support zone rests at the 1699-1700- look for a reaction there for guidance IF reached with a break below exposing subsequent support objectives at 1691, the May open at 1684 and 100% ext at 1673.

Bottom line: While the medium-term risk remains weighted to the downside in gold, the recent price sell-off is approaching uptrend support and we’re looking for a reaction. From at trading standpoint, look to reduce short exposure / lower protective stops on a test of 1700. Advances should be capped by the weekly open / HDC at 1731 – look for topside exhaustion ahead of this threshold IF price is indeed heading lower. Review my latest Gold Weekly Price Outlook for a closer look at the longer-term XAU/USD technical trading levels.
For a complete breakdown of Michael’s trading strategy, review his Foundations of Technical Analysis series on Building a Trading Strategy
Gold Trader Sentiment – XAU/USD Price Chart

- A summary of IG Client Sentiment shows traders are net-long Gold- the ratio stands at +2.61 (72.32% of traders are long) – bearishreading
- Long positions are5.06% lower than yesterday and 8.58% lower from last week
- Short positions are 0.66% higher than yesterday and 3.72% higher from last week
- We typically take a contrarian view to crowd sentiment, and the fact traders are net-long suggests Gold prices may continue to fall. Yet traders are less net-long than yesterday and compared with last week - from a sentiment standpoint, the recent changes in positioning warn that the current Gold price trend may soon reverse higher despite the fact traders remain net-long.
| Change in | Longs | Shorts | OI |
| Daily | 1% | -3% | -1% |
| Weekly | 2% | -8% | -2% |
---
Active Trade Setups
- Dollar vs Mexican Peso Technical Outlook: USD/MXN Breakdown Levels
- Canadian Dollar Technical Outlook: Loonie Rally Slams USD/CAD into Support
- S&P 500 Technical Analysis: Stock Rally Attempts Fifth Day – Warning?
- Japanese Yen Technical Outlook: USD/JPY Breakout Tests for Higher Low
- Sterling Technical Price Outlook: British Pound Breakout Potential
- Written by Michael Boutros, Technical Strategist with DailyFX
Follow Michael on Twitter @MBForex


