


Gold Technical Price Outlook: XAU/USD Near-term Trade Levels
- Gold price updated technical trade levels – Daily & Intraday Charts
- XAU/USD plummets more than 3.7% off yearly high / long-term uptrend resistance
- New to Gold Trading? Get started with this Free How to Trade Gold -Beginners Guide
Gold prices have plummeted more than 2.2% this week with XAU/USD under pressure after turning from long-term uptrend resistance last week. While the risk remains for a deeper set-back, the sell-off is now approaching initial support hurdles that could interrupt the current decline. These are the updated targets and invalidation levels that matter on the XAU/USD technical charts in the days ahead. Review my latest Weekly Strategy Webinar for an in-depth breakdown of this gold trade setup and more.
Gold Price Chart - XAU/USD Daily
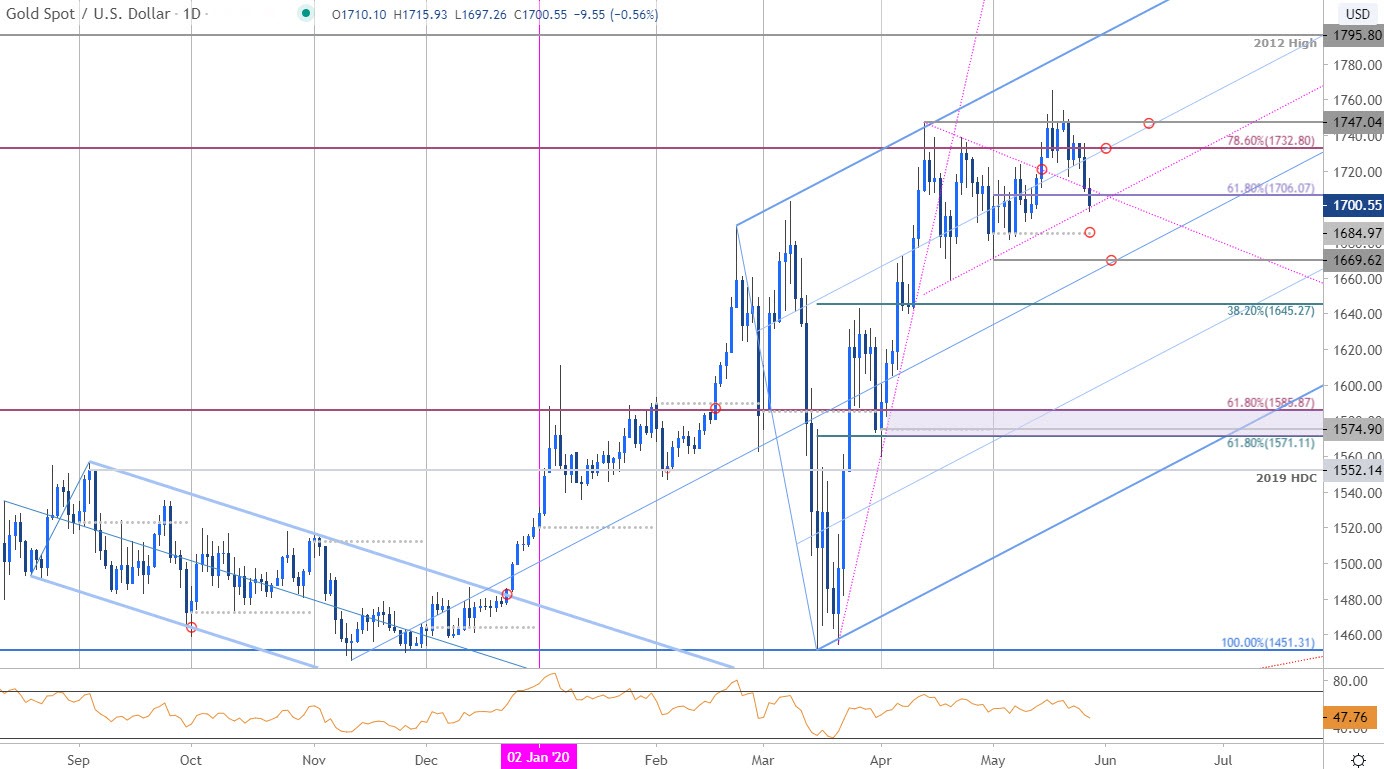
Chart Prepared by Michael Boutros, Technical Strategist; Gold on Tradingview
Technical Outlook: In my last Gold Price Outlook we noted that XAU/USD was, “in consolidation just below key resistance– from a trading standpoint, the risk remains for a deeper setback in prices while below the 1726.” A topside breach on May 14th briefly registered a high at 1765 before reversing with price now retrac ing more than 61.8% of the monthly range. The decline takes gold into parallel support of the dominant slope extending off the late April lows (magenta) – looking for a reaction here.
A break / close lower exposes the objective May open at 1685 backed by the monthly opening-range lows / pitchfork support at 1669 (key). Daily resistance now back at 1732 with a breach above the April highs at 1747 needed to challenge fresh highs in Gold.
Gold Price Chart - XAU/USD 120min

Notes: A closer look at Gold price action sees XAU/USD trading within the confines of an ascending pitchfork formation extending off the late-April lows with an embedded channel formation guiding this most recent decline. Initial support rests sat 1690/92 backed closely by 1685- risk for acceleration IF broken with such a scenario exposing the monthly lows at 1669. Initial resistance eyed at the 100% ext at 1714 backed by the upper parallel. Ultimately, a breach / close above the weekly open at 1735 would be needed to put the bulls back in control.

Bottom line: Gold prices are in correction off the monthly / yearly high with the pullback now approaching initial levels of up-trend support. From a trading standpoint, look to reduce short-exposure / lower protective stops on a test of 1690s – look for topside exhaustion while within this channel IF price is indeed heading lower with a break below the monthly range-lows needed to fuel the next leg in price. Ultimately, a larger pullback may offer more favorable entries closer to uptrend support. Review my latest Gold Weekly Price Outlook for a closer look at the longer-term XAU/USD technical trading levels.
For a complete breakdown of Michael’s trading strategy, review his Foundations of Technical Analysis series on Building a Trading Strategy
Gold Trader Sentiment – XAU/USD Price Chart
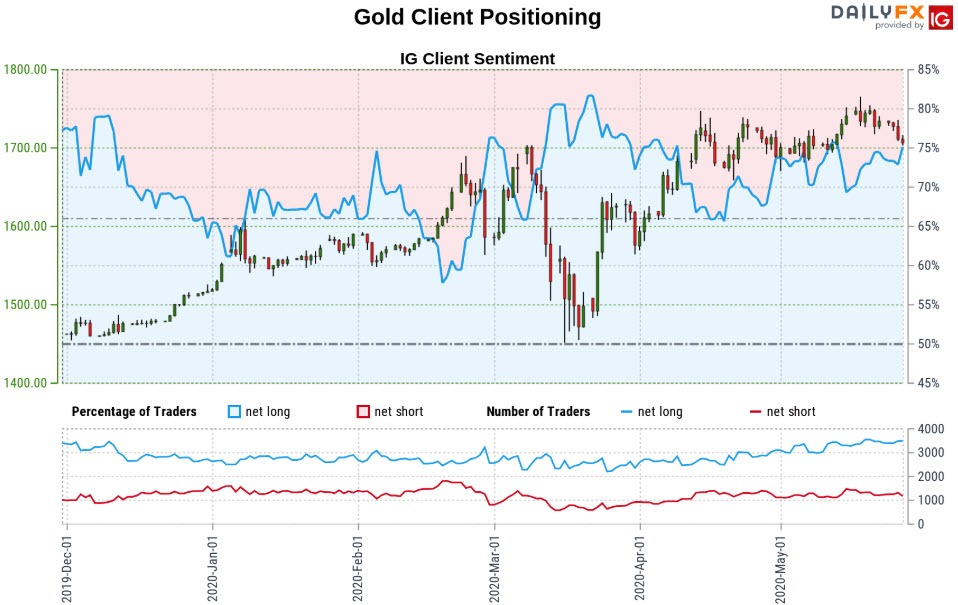
- A summary of IG Client Sentiment shows traders are net-long Gold- the ratio stands at +2.96 (74.78% of traders are long) – bearishreading
- Long positions are 0.69% higher than yesterday and 3.99% lower from last week
- Short positions are 9.82% lower than yesterday and 15.49% lower from last week
- We typically take a contrarian view to crowd sentiment, and the fact traders are net-long suggests Gold prices may continue to fall. Traders are further net-long than yesterday and last week, and the combination of current positioning and recent changes gives us a stronger Gold-bearish contrarian trading bias from a sentiment standpoint.
| Change in | Longs | Shorts | OI |
| Daily | 7% | -6% | 1% |
| Weekly | 12% | -10% | 1% |
---
Active Trade Setups
- Japanese Yen Technical Outlook: USD/JPY Breakout Tests for Higher Low
- Canadian Dollar Technical Price Outlook: Loonie Coils into May Range
- Sterling Technical Price Outlook: British Pound Breakout Potential
- S&P 500 Technical Outlook: SPX500 Rally at Key Resistance Hurdle
- Dollar vs Mexican Peso Technical Outlook: USD/MXN Coil Continues
- Written by Michael Boutros, Technical Strategist with DailyFX
Follow Michael on Twitter @MBForex


