


S&P 500 Index Technical Price Outlook: SPX500 Near-term Trade Levels
- S&P 500 Index updated technical trade levels & sentiment – Daily & 120min Charts
- SPX500 rally attempting 5th consecutive day - approaching resistance at multi-month highs
- What is S&P 500? A Guide to the S&P 500 Index
The S&P 500 Index surged more than 3% as investors weigh the prospects of the economic re-opening and the impact on future growth. The advance is now approaching resistance targets at multi-month highs and will be a test for the bulls. Does the economic outlook warrant such a rally? This test of resistance may be the tell. These are the updated targets and invalidation levels that matter on the SPX500 technical price charts. Review my latest Weekly Strategy Webinar for an in-depth breakdown of this S&P 500 trade setup and more.
S&P 500 Price Chart – SPX500 Daily
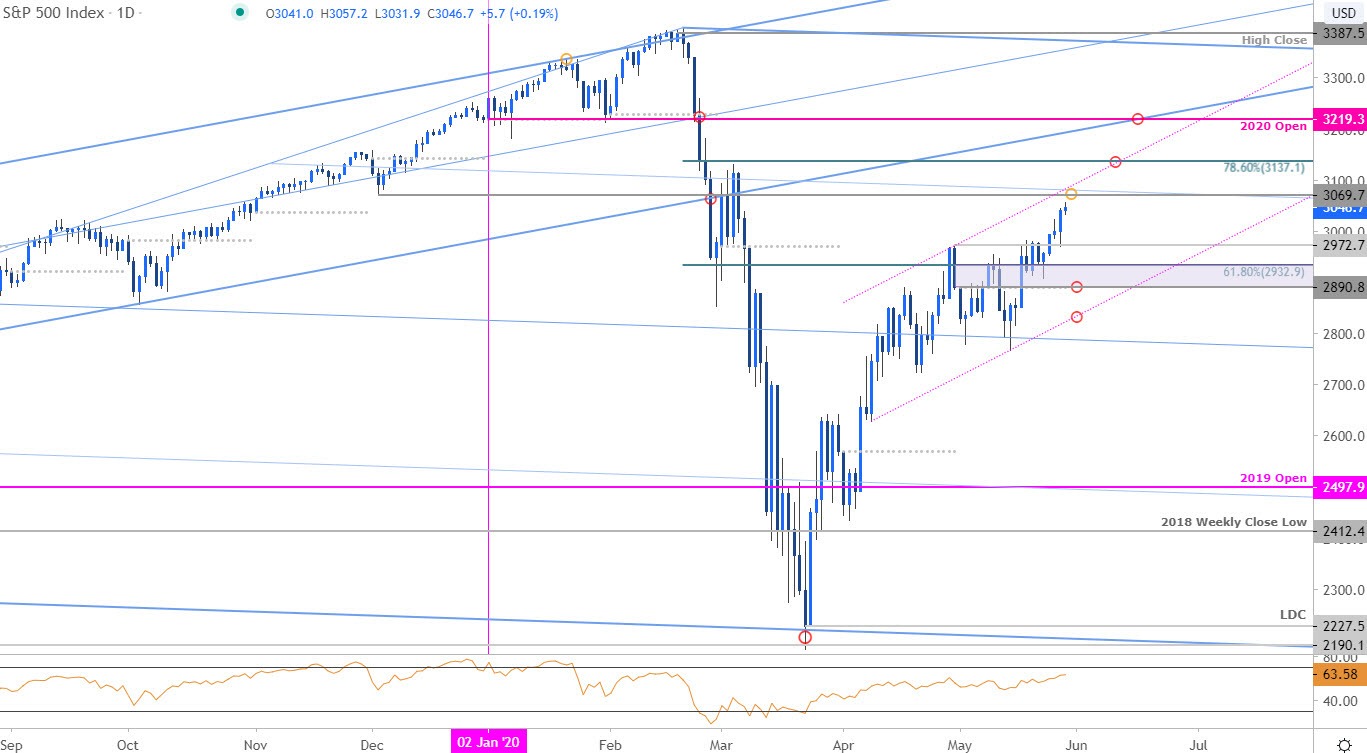
Chart Prepared by Michael Boutros, Technical Strategist; S&P 500 Index on Tradingview
Technical Outlook: In my last S&P 500 Price Outlook we noted that the, “S&P 500 rebound is approaching key resistance at a range which has already offered a false breakout- use caution here.” The region in focus was 2932- a level defined by the 61.8% retracement of the yearly range. A false breakout in late-April was followed by multiple attempts in May trade with a break / close above 18th clearing the way for a larger price advance.
The rally is now approaching the December lows at 3069 with channel resistance looming just higher – the immediate advance may be vulnerable into this threshold. Monthly open support rests at 2890 with a break / close below channel support needed to validate a reversal. A breach higher from here exposes subsequent topside resistance objectives at 3137 and the yearly open at 3219.
S&P 500 Price Chart – SPX500 120min
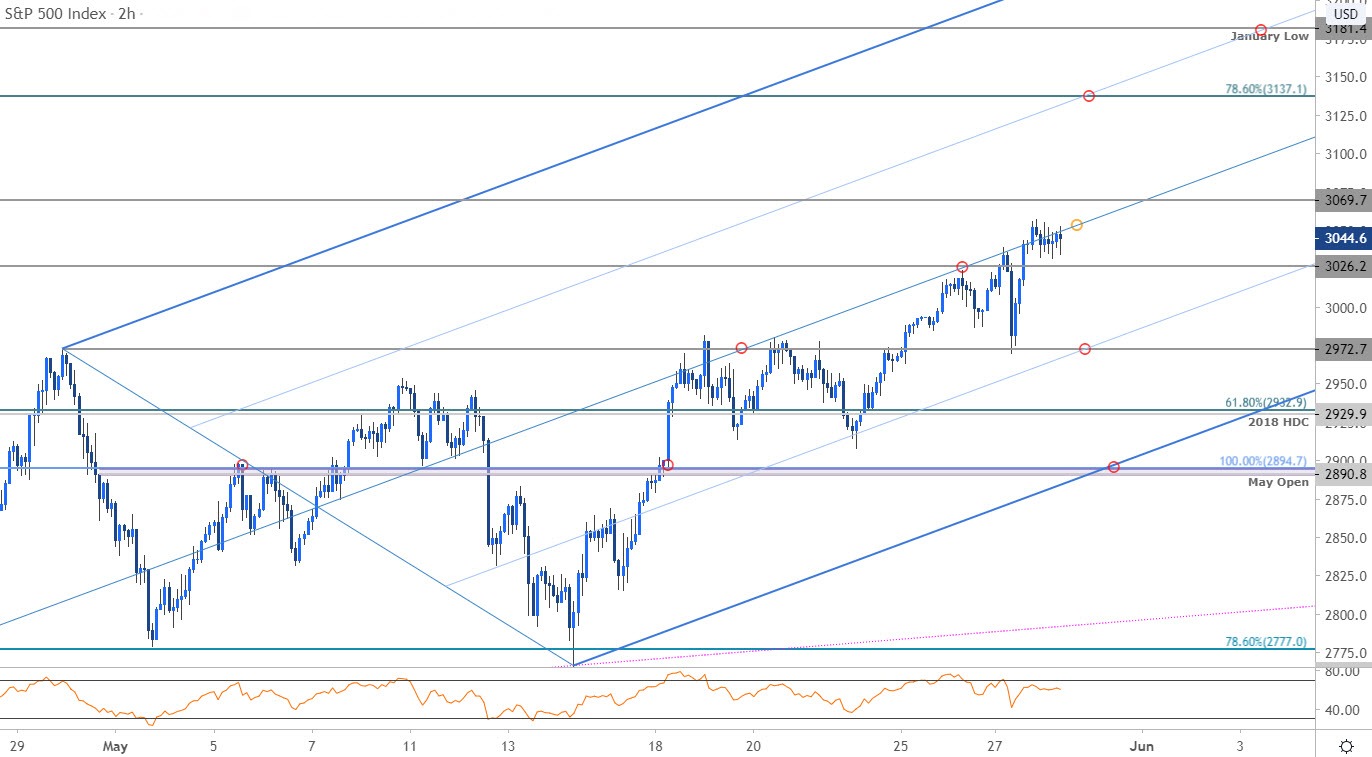
Notes: A closer look at S&P 500 price action shows the index trading within the confines of an ascending pitchfork formation extending off the 4/24 & 5/14 lows with the rally testing median-line resistance on building divergence today in early New York trade. Look for a reaction on a stretch into 3069 - a close above is needed to keep the immediate long-bias viable with such a scenario exposing the 78.6% retracement at 3137 and the January low at 3181. Initial support rests at 2972 backed by 2930/32 with near-term bullish invalidation now raised to the 2890/94.

Bottom line: The S&P 500 is approaching secondary breakout targets up here and the rally may be vulnerable heading into uptrend resistance. From a trading standpoint, look to reduce long-exposure / raise protective stops on a test of 3069- look for a reaction there for guidance with a close above needed to keep the bulls in control. Weakness should be capped by 2930 IF price is indeed heading higher.
For a complete breakdown of Michael’s trading strategy, review his Foundations of Technical Analysis series on Building a Trading Strategy
S&P 500 Trader Sentiment – SPX500 Price Chart
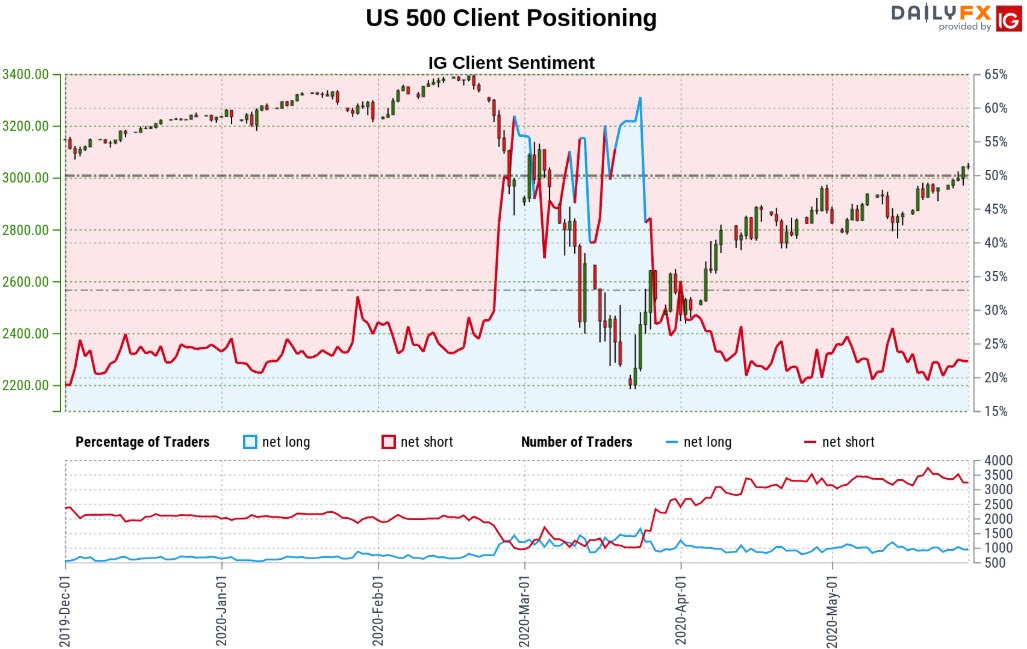
- A summary of IG Client Sentiment shows traders are net-short the index - the ratio stands at -3.22 (23.67% of traders are long) – bullishreading
- Long positions are11.05% lower than yesterday and 1.82% higher from last week
- Short positions are 0.22% lower than yesterday and 10.46% lower from last week
- We typically take a contrarian view to crowd sentiment, and the fact traders are net-short suggests US 500 prices may continue to rise. Yet traders are more net-short than yesterday but less net-short from last week and the combination of current positioning and recent changes gives us a further mixed US 500 trading biasfrom a sentiment standpoint.
| Change in | Longs | Shorts | OI |
| Daily | 0% | -6% | -3% |
| Weekly | 29% | -20% | -2% |
---
Active Trade Setups
- Gold Price Technical Outlook: XAU/USD Correction Approaching Support
- Japanese Yen Technical Outlook: USD/JPY Breakout Tests for Higher Low
- Canadian Dollar Technical Price Outlook: Loonie Coils into May Range
- Sterling Technical Price Outlook: British Pound Breakout Potential
- Dollar vs Mexican Peso Technical Outlook: USD/MXN Coil Continues
- Written by Michael Boutros, Currency Strategist with DailyFX
Follow Michael on Twitter @MBForex


