


Mexican Peso Technical Price Outlook: USD/MXN Near-term Trade Levels
- Mexican Peso updated technical trade levels – Weekly & Daily Charts
- USD/MXN plummets more than 15% to fresh multi-month lows
- Risk for a deeper correction while below 22.1503- key support 21.2316
The US Dollar is poised to mark the fourth consecutive weekly decline against the Mexican Peso with price now down more than 15% off the record highs in April. The decline has now broken below a key support pivot we’ve been tracking and keeps the risk weighted to the downside heading into the June open. These are the updated targets and invalidation levels that matter on the USD/MXN technical price charts. Review my latest Strategy Webinar for an in-depth breakdown of this Peso trade setup and more.
Mexican Peso Price Chart – USD/MXN Weekly
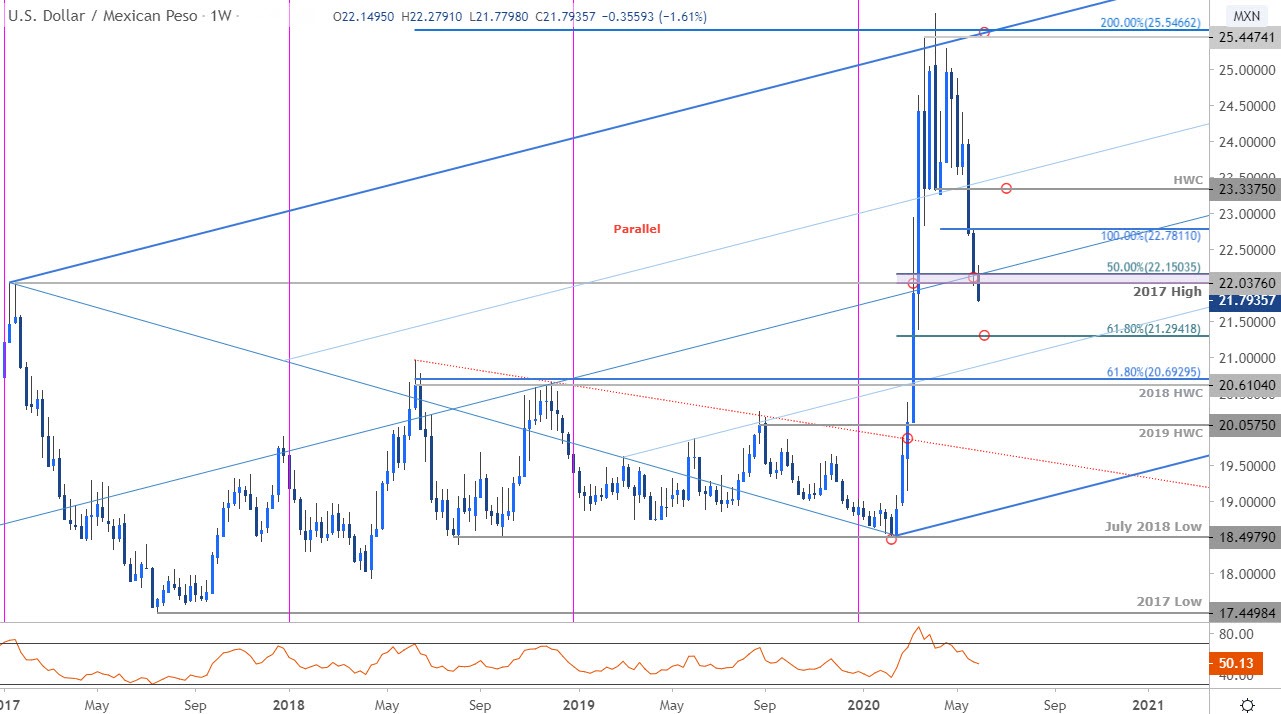
Chart Prepared by Michael Boutros, Technical Strategist; USD/MXN on Tradingview
Technical Outlook: In my last Mexican Peso Price Outlook we noted that USD/MXN was approaching support with a, “break / close below 23.9074 needed to keep the focus lower in the dollar.” A break of the monthly opening-range lows on May 20th fueled a decline of more than 8% into the close of the month before closing just above a key support pivot at the 2017 high / 50% retracement at 22.0376/1495- the Dollar is breaking this confluence zone into the start of June trade and the risk remains for further losses while below.
Mexican Peso Price Chart – USD/MXN Daily
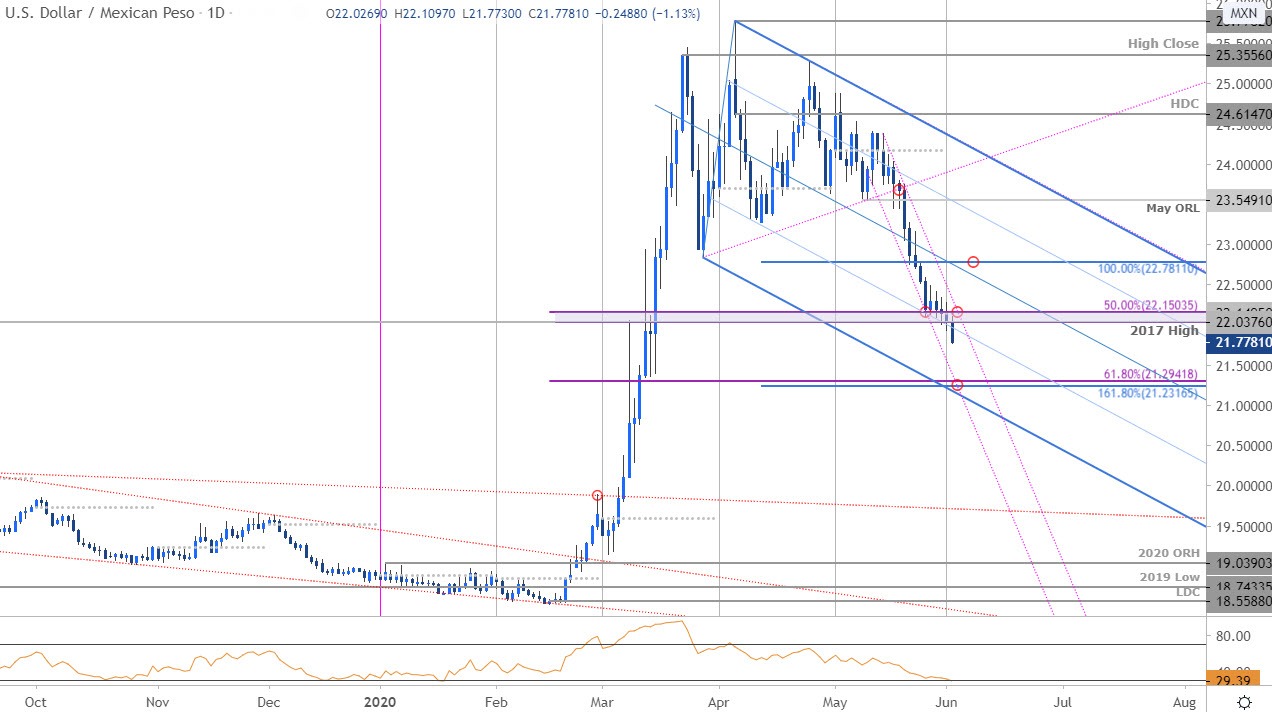
Notes: A closer look at Peso price action shows USD/MXN continuing to trade within the confines of the descending pitchfork formation we’ve been tracking off record highs with a break below the 25% parallel today further highlighting the risk for losses here. An embedded descending channel keeps the focus on confluence support at 21.2316/2941- look for a larger reaction there IF reached. Near-term bearish invalidation now at 22.1503 with a breach above the median-line / 100% ext at 22.7811 needed to shift the broader focus back to the long-side in the Dollar.

Bottom line: The Mexican Peso rally has taken USD/MXN below a key support pivot in price and leaves the pair vulnerable to further losses heading into June trade. From a trading standpoint, look to reduce short-exposure / lower protective stops on a test of the lower parallel – keep an eye out for a reaction there for guidance. Ultimately, a breach above 22.7811 would be needed to put the bulls back in control.
For a complete breakdown of Michael’s trading strategy, review his Foundations of Technical Analysis series on Building a Trading Strategy
---
Key US / Mexico Data Releases
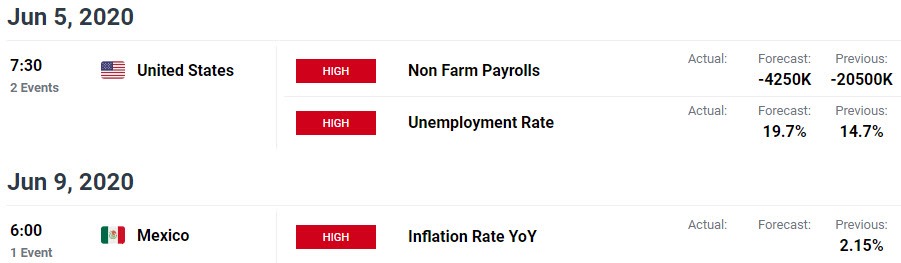
Economic Calendar - latest economic developments and upcoming event risk.
Active Trade Setups
- Canadian Dollar Technical Outlook: Loonie Rally Slams USD/CAD into Support
- S&P 500 Technical Analysis: Stock Rally Attempts Fifth Day – Warning?
- Gold Price Technical Outlook: XAU/USD Correction Approaching Support
- Japanese Yen Technical Outlook: USD/JPY Breakout Tests for Higher Low
- Sterling Technical Price Outlook: British Pound Breakout Potential
--- Written by Michael Boutros, Technical Strategist with DailyFX
Follow Michael on Twitter @MBForex


