


Gold Price Forecast Overview:
- Gold prices have benefited greatly from the decline in crude oil prices, a strong signal that more stimulus is coming as major economies flail.
- Gold prices are rallying anew, thanks in part to the jump in gold volatility in recent days.
- According to the IG Client Sentiment Index, gold prices retain a bullish trading bias.
Gold Prices Rally as Equities Slump, Oil Slides
Gold prices have been marching hire again, thanks in part to the deterioration in risk appetite around the collapse in the WTI crude oil futures curve. Quirks about contract liquidity aside, the fact of the matter is that the crude oil glut in the United States speaks to the lack of substantive demand for energy, a bonafide indicator that a major economic downturn is afoot.
To this end, markets are fully aware that more stimulus will be coming down the pipeline, not just from the United States (fiscal and monetary), but from the Eurozone and other advanced economic nations. An environment defined by aggressive stimulus depressing government bond yields, regardless of the inflation outlook, tends to be a supportive fundamental bedrock for precious metals, particularly gold priecs.

Gold Volatility Begins to Rebound
Gold prices have a relationship with volatility unlike other asset classes. While other asset classes like bonds and stocks don’t like increased volatility – signaling greater uncertainty around cash flows, dividends, coupon payments, etc. – gold tends to benefit during periods of higher volatility. Heightened uncertainty in financial markets due to increasing macroeconomic tensions increases the safe haven appeal of gold.
GVZ (Gold Volatility) Technical Analysis: Daily Price Chart (October 2008 to April 2020) (Chart 1)
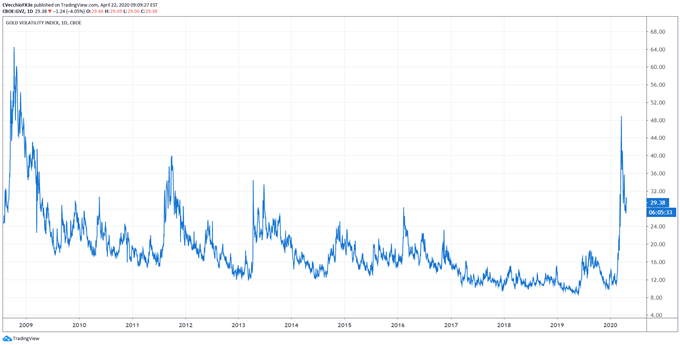
Gold volatility (as measured by the Cboe’s gold volatility ETF, GVZ, which tracks the 1-month implied volatility of gold as derived from the GLD option chain) is trading at 29.38, having rebounded from its March 16 low of 23.96.
Accordingly, the correlations between gold prices and gold volatility have started to strengthen. The 5-day correlation between GVZ and gold prices is -0.09 while the 20-day correlation is -0.51; one week ago, on April 15, the 5-day correlation was -0.55 and the 20-day correlation was -0.69; and one month ago, on March 24, the 5-day correlation was -0.15 and the 20-day correlation was -0.74.
Unlike during the first half of April, when gold prices rallied and gold volatility fell, we’re now starting to see both align in tandem. In the last gold price technical forecast update, it was noted that “as has been the case many times over the past year, when gold volatility falls but gold prices do not follow, leading to a situation of negative correlations in the short-term, it has typically indicated a digestion period for the market prior to further gains.”
Gold Price Technical Analysis: Daily Chart (April 2019 to April 2020) (Chart 2)
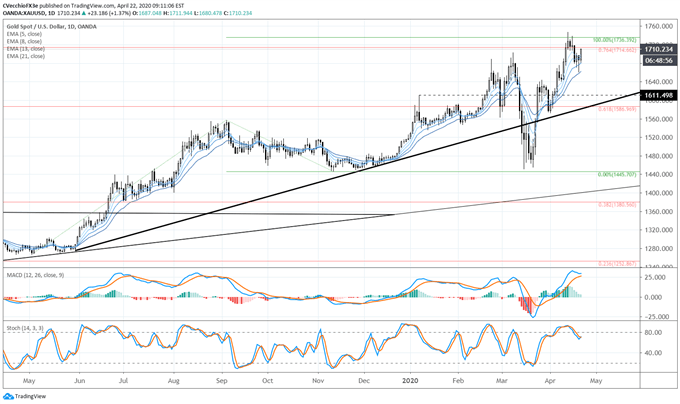
In the last gold price technical forecast, it was noted that “gold prices may have just reached a confluence of resistance that could yield a near-term pause in the rally.” After dipping back over the past week following the achievement of two key Fibonacci targets, gold prices pulled back to the daily 21-EMA, finding support ahead of the moving average before turning higher.
The Fibonacci extension taken from the May 2019 low, September 2019 high, and November 2019 low calculated a 100% extension target at 1736.39. Gold prices have contended with the 76.4% retracement of the 2011 high to 2015 low range at 1714.66 as well.
The pullback may now allow gold prices to advance beyond both of these key Fibonacci levels after the brief period of digestion.
Momentum is firming to the topside, with gold prices above their daily 5-, 8-, 13-, and 21-EMA envelope, which is in bullish sequential order. Daily MACD is rising in bullish territory, while Slow Stochastics have started to rise in the area just below overbought territory. A breach of the yearly highs may be in the cards.
Gold Price Technical Analysis: Weekly Chart – Inverse Head and Shoulders Pattern (May 2011 to April 2020) (Chart 3)
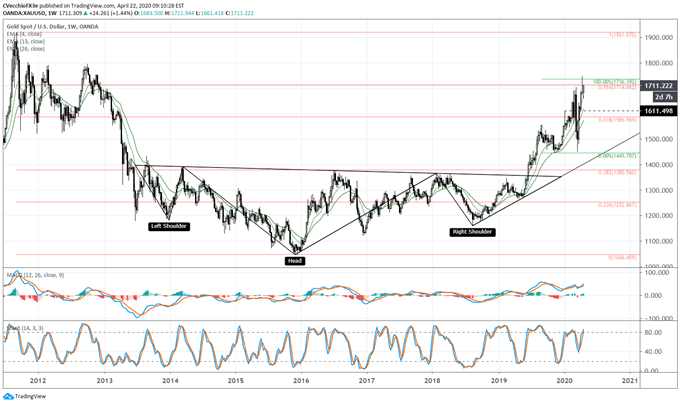
Gold prices have made significant progress within the confines of the multi-year inverse head & shoulders pattern, achieving their highest level since November 2012 earlier this week. It thus still holds that the rally into and through the 76.4% retracement (1714.66) must be viewed in context of the longer-term technical picture: the gold price inverse head and shoulders pattern that originated earlier this year is still valid and guiding gold price action.
Depending upon the placement of the neckline, the final upside targets in a potential long-term gold price rally, if drawing the neckline breakout against the August 2013 high at 1433.61, calls for a final target at 1820.99.
IG Client Sentiment Index: Gold Price Forecast (April 22, 2020) (Chart 4)
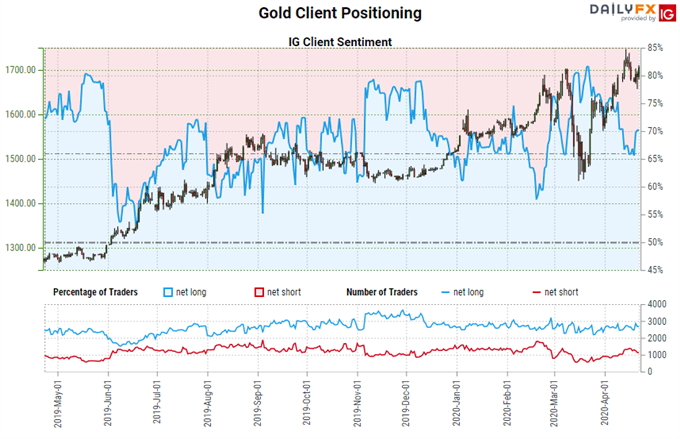
Gold: Retail trader data shows 74.00% of traders are net-long with the ratio of traders long to short at 2.85 to 1. The number of traders net-long is 8.72% higher than yesterday and 12.22% higher from last week, while the number of traders net-short is 11.84% lower than yesterday and 22.43% lower from last week.
We typically take a contrarian view to crowd sentiment, and the fact traders are net-long suggests Gold prices may continue to fall.
Traders are further net-long than yesterday and last week, and the combination of current sentiment and recent changes gives us a stronger Gold-bearish contrarian trading bias.

--- Written by Christopher Vecchio, CFA, Senior Currency Strategist
To contact Christopher Vecchio, e-mail at cvecchio@dailyfx.com


