


Gold Price Forecast Overview:
- Gold prices have rallied sharply over the past few weeks, bringing price into a confluence of key resistance on longer-term timeframes.
- The typical positive relationship between gold prices and gold volatility has eroded, insofar as the decline in gold volatility has not been matched by a corresponding decline in gold prices.
- According to the IG Client Sentiment Index, gold prices retain a bullish trading bias.
Gold Prices Struggle as Geopolitical Tensions Ebb
Gold prices have continued their march higher in 2020 as the first few weeks of the second quarter have come to pass. The flow of concerning economic data continues to come down the pipeline, this morning in the form of an historically bad US retail sales report, the worst on record.
With the prospect of significant economic risk on the near-term horizon, coupled with extraordinary efforts by fiscal and monetary authorities around the globe, gold prices remain in sound fundamental shape. Yet recent price developments suggest that the recent rally may have reached a natural inflection point, a place where traders may see a brief pause before further gains.

Gold Volatility Continues to Pullback
First, it’s important to comment on the deterioration in the typically positive relationship between gold prices and gold volatility; gold prices have a relationship with volatility unlike other asset classes. While other asset classes like bonds and stocks don’t like increased volatility – signaling greater uncertainty around cash flows, dividends, coupon payments, etc. – gold tends to benefit during periods of higher volatility. Heightened uncertainty in financial markets due to increasing macroeconomic tensions increases the safe haven appeal of gold. As does the expectation of stimulative monetary policy. On the other hand, decreased volatility tends to harm gold prices.
GVZ (Gold Volatility) Technical Analysis: Daily Price Chart (October 2008 to April 2020) (Chart 1)
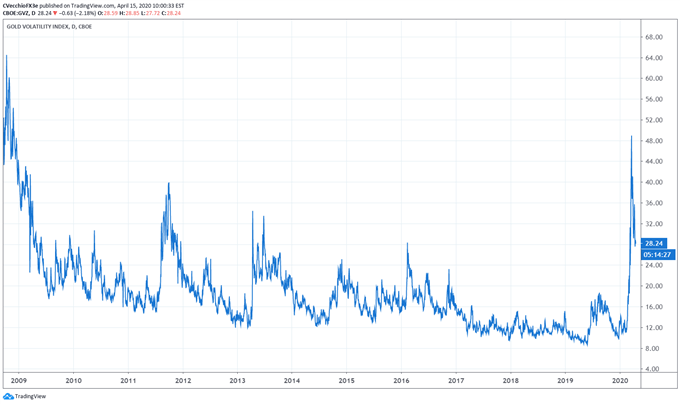
Gold volatility (as measured by the Cboe’s gold volatility ETF, GVZ, which tracks the 1-month implied volatility of gold as derived from the GLD option chain) is trading at 28.24, having been nearly cut in half since its high on March 18 at 54.37 (it closed March 18 at 48.98). Yet despite the sharp plunge in gold volatility in recent weeks – it’s still high by historical standards – gold prices have not follow suit: it was just yesterday that a fresh yearly high at 1747.72 was established.
Accordingly, the correlations between gold prices and gold volatility have eroded, insofar as the decline in gold volatility has not been matched by a corresponding decline gold prices. The 5-day correlation between GVZ and gold prices is -0.52 while the 20-day correlation is -0.69; one month ago, on March 18, the 5-day correlation was -0.90 and the 20-day correlation was -0.76.
But these may be positive developments for gold prices, long-term: as has been the case many times over the past year, when gold volatility falls but gold prices do not follow, leading to a situation of negative correlations in the short-term, it has typically indicated a digestion period for the market prior to further gains.
Gold Price Technical Analysis: Daily Chart (April 2019 to April 2020) (Chart 2)
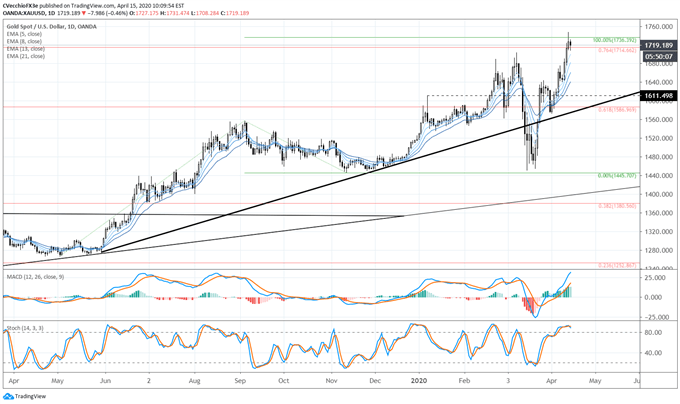
The Fibonacci extension taken from the May 2019 low, September 2019 high, and November 2019 low calculated a 100% extension target at 1736.39, which remains a valid measurement target given that the November 2019 swing lows were never broken during gold prices’ declines just a few weeks ago. To this end, the 100% target at 1736.39 was reached yesterday, when gold prices reached 1747.72.
Furthermore, gold prices have also reached the 76.4% retracement of the 2011 high to 2015 low range at 1714.66, more evidence that the multi-year inverse head & shoulders bottoming pattern remains valid and the driving framework for our long-term gold outlook (more on that below).
Indeed, gold prices have made an impressive rally off of their March lows, which established themselves just above the November 2019 swing lows near 1445.71. But gold prices may have just reached a confluence of resistance that could yield a near-term pause in the rally.
Gold Price Technical Analysis: Weekly Chart – Inverse Head and Shoulders Pattern (May 2011 to April 2020) (Chart 3)
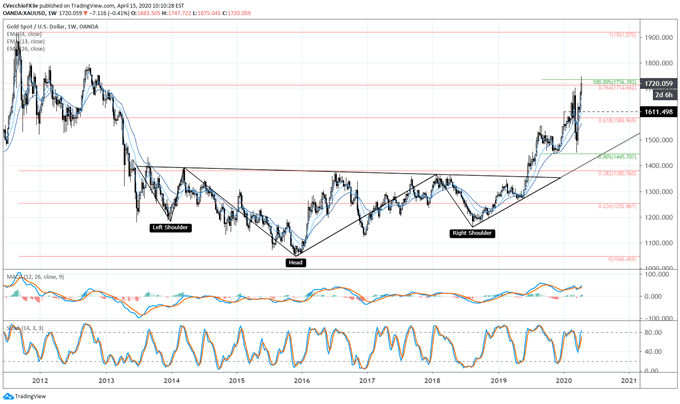
Gold prices have made significant progress within the confines of the multi-year inverse head & shoulders pattern, achieving their highest level since November 2012 earlier this week. It thus still holds that the rally into and through the 76.4% retracement (1714.66) must be viewed in context of the longer-term technical picture: the gold price inverse head and shoulders pattern that originated earlier this year is still valid and guiding gold price action.
Depending upon the placement of the neckline, the final upside targets in a potential long-term gold price rally, if drawing the neckline breakout against the August 2013 high at 1433.61, calls for a final target at 1820.99.
IG Client Sentiment Index: Gold Price Forecast (April 15, 2020) (Chart 4)
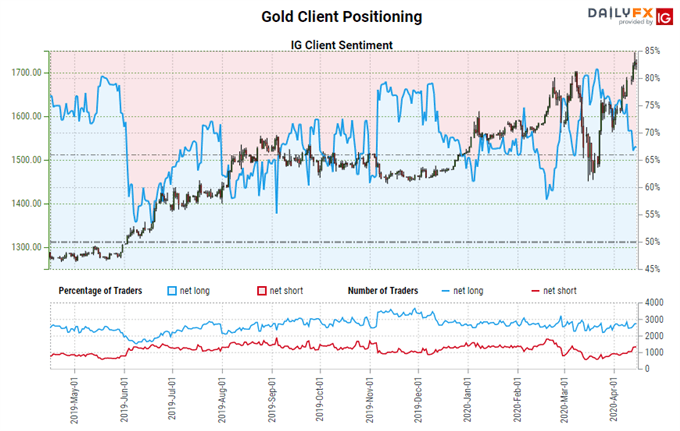
Gold: Retail trader data shows 65.68% of traders are net-long with the ratio of traders long to short at 1.91 to 1. The number of traders net-long is 6.31% lower than yesterday and 3.96% lower from last week, while the number of traders net-short is 2.76% higher than yesterday and 45.26% higher from last week.
We typically take a contrarian view to crowd sentiment, and the fact traders are net-long suggests Gold prices may continue to fall.
Yet traders are less net-long than yesterday and compared with last week. Recent changes in sentiment warn that the current Gold price trend may soon reverse higher despite the fact traders remain net-long.

--- Written by Christopher Vecchio, CFA, Senior Currency Strategist
To contact Christopher Vecchio, e-mail at cvecchio@dailyfx.com
Follow him on Twitter at @CVecchioFX
View our long-term forecasts with the DailyFX Trading Guides


