


Gold Price Forecast Overview:
- Despite weakness around the November US jobs report, gold prices have been able to maintain their sideways move that has developed over the past month.
- Upcoming event risk caters to higher volatility in the near-term, which is typically supportive of gold prices: the December Fed rate decision on Wednesday; and the December ECB rate decision and the UK general election on Thursday.
- According to the IG Client Sentiment Index, gold prices have a mixed outlook in the near-term, which coincides with a cloudy technical picture.
Looking for longer-term forecasts on Gold and Silver prices? Check out the DailyFX Trading Guides.
Macro Event Risk Runs High: FOMC, ECB, UK Election
Financial markets are bearing down for a tidal wave of event risk over the coming days. In any other week, the back-to-back scheduling of the Federal Reserve and European Central Bank rate decisions would call for fireworks in FX markets.
Alas, these prime sources of event risk – the December Fed meeting and the December ECB meeting on Wednesday and Thursday, respectively – may be overshadowed. But traders would be remiss to ignore the calendar otherwise.
The UK general election on December 12 has received the bulk of attention in recent days, at least when traders’ collective attention has been turned away from the news wire seeking the latest updates on the US-China trade war and the USMCA. In turn, with such a high degree of uncertainty in such a small window of time, gold prices have been able to catch a bid and stabilize after last week’s late decline.
Read more: GBP/JPY, GBP/USD Extend Gains Ahead of UK General Election - Brexit Latest
Gold Prices Trading in Lockstep with Gold Volatility
Precious metals like gold have a relationship with volatility unlike other asset classes. While other asset classes like bonds and stocks don’t like increased volatility – signaling greater uncertainty around cash flows, dividends, coupon payments, etc. – precious metals tend to benefit during periods of higher volatility.
Heightened uncertainty in financial markets due to increasing macroeconomic tensions (like US-China trade) increases the safe haven appeal of gold. On the other hand, decreased volatility tends to harm gold prices.
GVZ (Gold Volatility) Technical Analysis: Daily Price Chart (December 2016 to December 2019) (Chart 1)
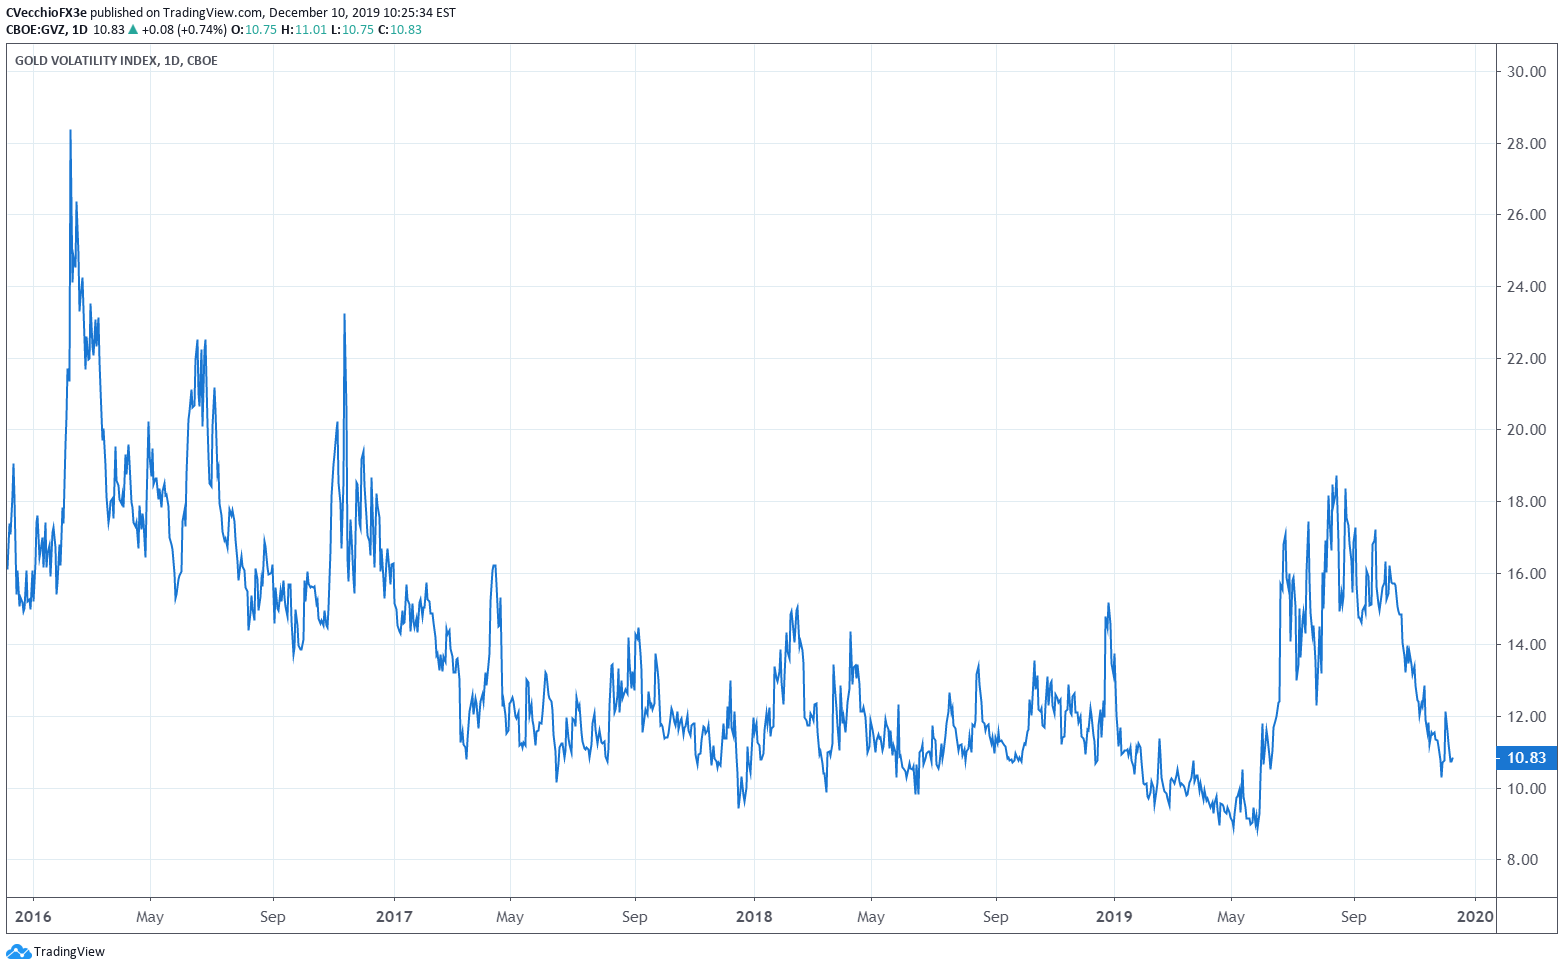
Gold volatility (as measured by the Cboe’s gold volatility ETF, GVZ, which tracks the 1-month implied volatility of gold as derived from the GLD option chain) was trading at 10.83. Gold volatility has moved sideways for the past month, having closed every session since November 12 between 10.30 and 12.15.
Accordingly, with both gold prices following gold volatility’s sideways move, the typical relationship between gold prices and gold volatility remains in place: the 5-day correlation between GVZ and gold prices is 0.92 while the 20-day correlation is 0.58; in the prior gold volatility update, the 5-day correlation was 0.88 and the 20-day correlation was 0.15.
Gold Price Technical Analysis: Daily Chart - Descending Channel (December 2018 to December 2019) (Chart 2)
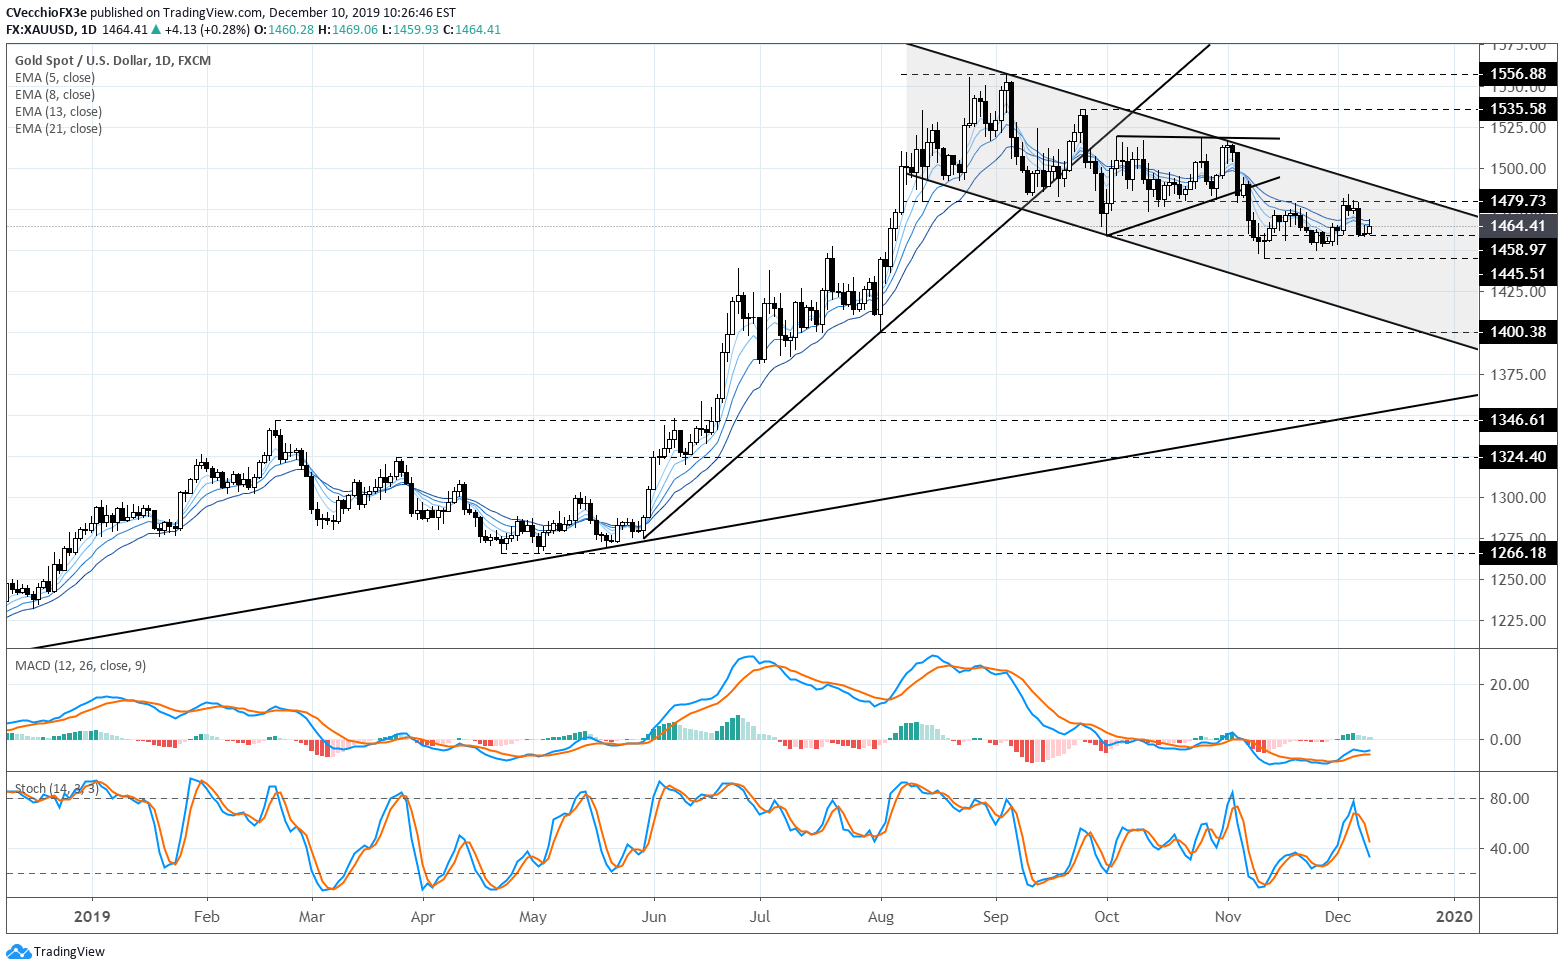
In last week’s gold price forecast, the outlook noted that “the descending channel from the September and November highs continues to hold, and the latest rally never even got a chance at reaching downtrend resistance. Underlying fundamental weakness is apparent in the failed attempts to change the technical narrative.” To this end, nothing has changed in a material way for gold prices.
Gold prices are intertwined among the daily 5-, 8-, 13-, and 21-EMA envelope, which is in neither bearish nor bullish sequential order. Daily MACD is shifting lower, still in bearish territory, while Slow Stochastics have trended lower below their median line.
Accordingly, with gold prices moving sideways in recent days, it still holds that “a move down below 1458.97 increases the odds of a return to the November low at 1445.51.” Furthermore, a bullish outlook for gold prices would only be valid if the descending channel from the September and November highs breaks, which would occur above 1487.50 by the end of this week.
Gold Price Technical Analysis: Weekly Chart – Inverse Head and Shoulders Pattern (July 2011 to December 2019) (Chart 3)
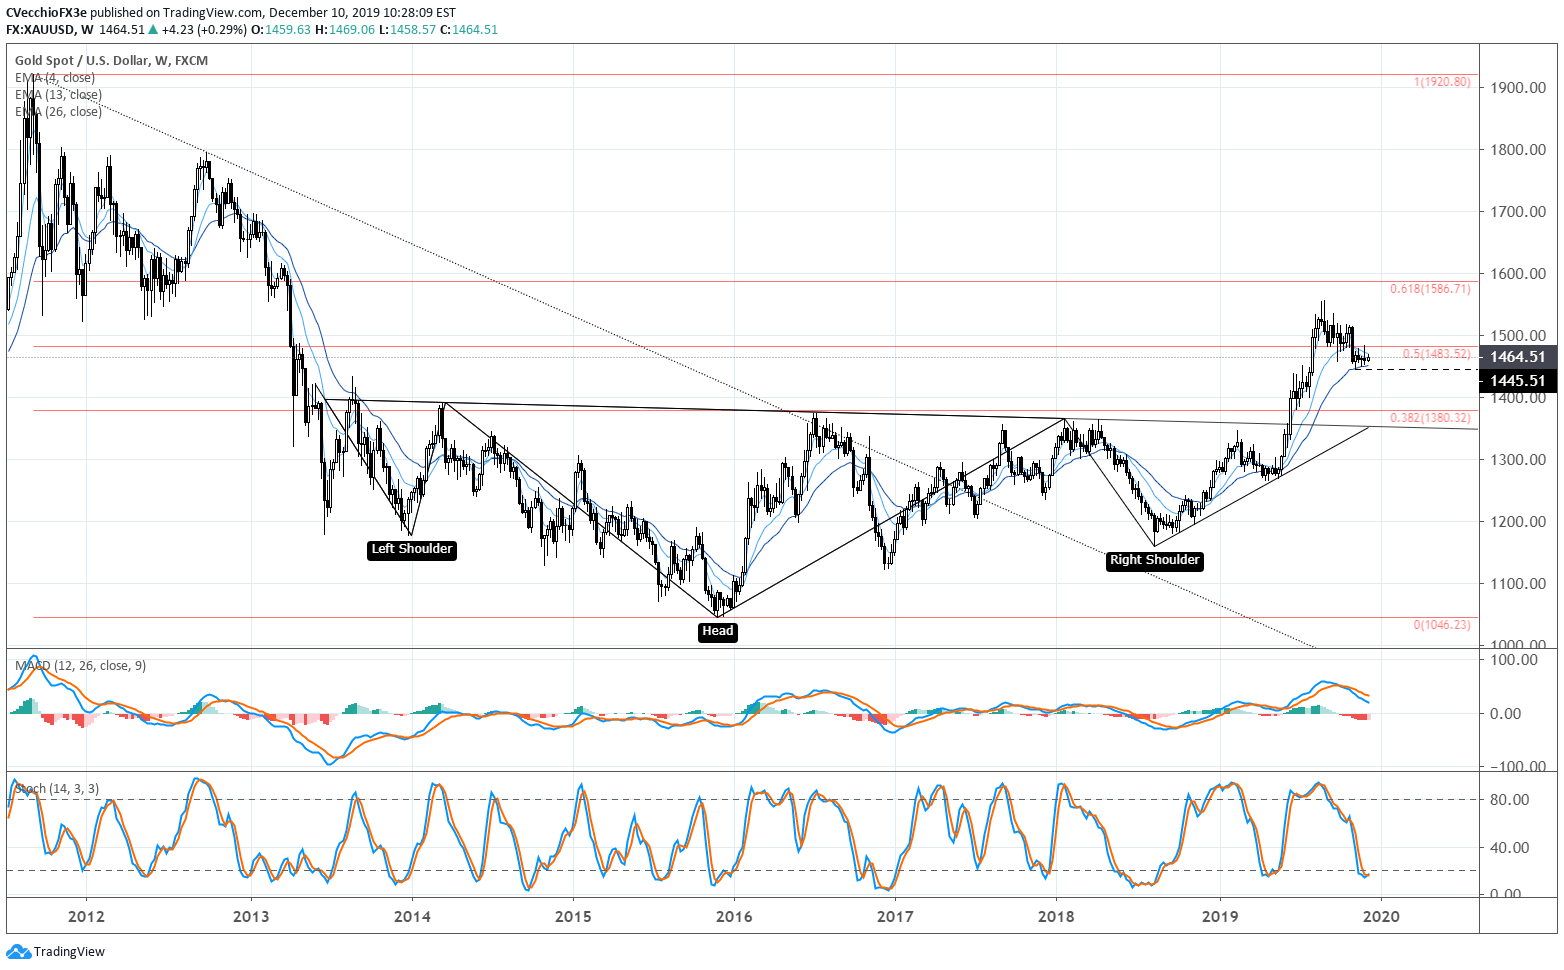
The weekly timeframe continues to move at a snail’s pace, and there is no change since the last gold price forecast update. The gold price pullback since the October Fed meeting must be viewed in context of the longer-term technical picture: the gold price inverse head and shoulders pattern that originated earlier this year is still valid.
Depending upon the placement of the neckline, the final upside targets in a potential long-term gold price rally vary: conservatively, drawing the neckline breakout against the January 2018 high at 1365.95 calls for a final target at 1685.67; aggressively, drawing the neckline breakout against the August 2013 high at 1433.61 calls for a final target at 1820.99.
Only a break below the August 1 bullish outside engulfing bar low at 1400.38 would draw into question the longer-term bullish potential for gold prices. It’s worth noting that the weekly 26-EMA – the six-month average – has held up as support on a closing basis since gold prices first returned to it during the second week of November 2019; a break below here could be an ominous signal.
IG Client Sentiment Index: Gold Price Forecast (December 10, 2019) (Chart 4)
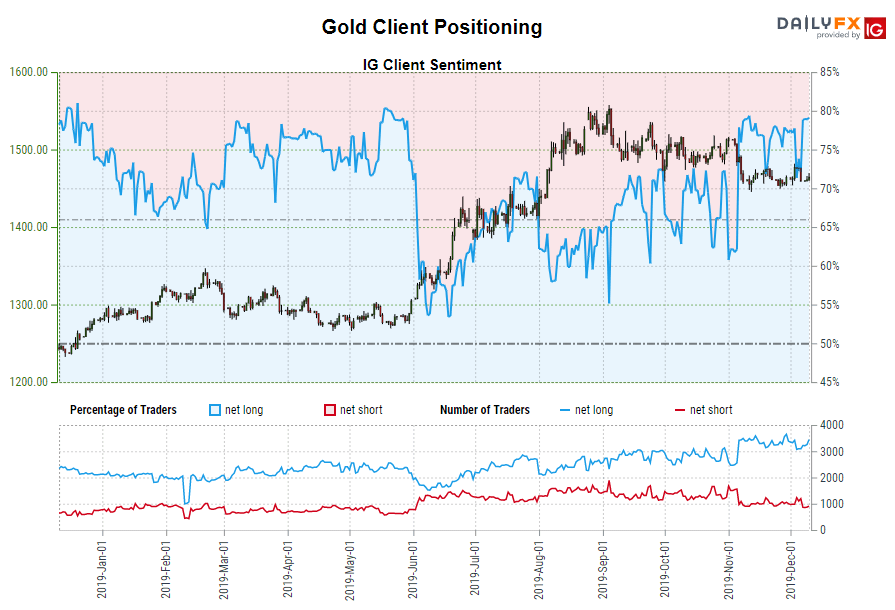
Gold: Retail trader data shows 77.90% of traders are net-long with the ratio of traders long to short at 3.52 to 1. The number of traders net-long is 0.23% lower than yesterday and 1.91% lower from last week, while the number of traders net-short is 8.54% higher than yesterday and 3.55% lower from last week.
We typically take a contrarian view to crowd sentiment, and the fact traders are net-long suggests gold prices may continue to fall. Positioning is less net-long than yesterday but more net-long from last week. The combination of current sentiment and recent changes gives us a further mixed gold trading bias.
Read more: Gold Price Forecast: Downtrend Continues after US Jobs Report - Next Levels for XAU/USD
FX TRADING RESOURCES
Whether you are a new or experienced trader, DailyFX has multiple resources available to help you: an indicator for monitoring trader sentiment; quarterly trading forecasts; analytical and educational webinars held daily; trading guides to help you improve trading performance, and even one for those who are new to FX trading.
--- Written by Christopher Vecchio, CFA, Senior Currency Strategist
To contact Christopher Vecchio, e-mail at cvecchio@dailyfx.com
Follow him on Twitter at @CVecchioFX
View our long-term forecasts with the DailyFX Trading Guides


