


Gold Price Forecast Overview:
- A surprisingly robust November US jobs report has lifted US Treasury yields and the US Dollar, erasing all of gold’s gains on the week.
- Gold volatility is at a fresh monthly low, and as it fairly typical, gold prices are following right behind. For gold prices, failure to clear the downtrend from the September and November highs suggests more losses may be ahead.
- Per the IG in IG Client Sentiment Index, gold prices have a mixed outlook at present time.
Looking for longer-term forecasts on Gold and Silver prices? Check out the DailyFX Trading Guides.
US-China Trade War Takes a Backseat to US Jobs Report
The back-and-forth headlines regarding the US-China trade war over the course of the week proved to be a healthy development for gold prices: more uncertainty regarding the timing of the Phase 1 deal yielded increased volatility across markets. And while gold prices had initially looked like they were on their way to a strong start as the first week of December wound down, the shift in attention from the US-China trade war to US economic data has come at gold’s expense.
The November US jobs report helped produce another all-time low in the unemployment rate, while headline labor market growth easily beat expectations; granted, there was a one-off impact of the GM workers returning from their strike.
Nevertheless, the US jobs data reinforced the notion that the Federal Reserve wouldn’t be cutting rates anytime soon, sending US Treasury yields higher. Reduced fears of an immediate US recession are likely driving price action as well; after all, volatility continues to trend lower across the board.
Gold Prices Continues to Track Gold Volatility Very Closely
Precious metals like gold have a relationship with volatility unlike other asset classes. While other asset classes like bonds and stocks don’t like increased volatility – signaling greater uncertainty around cash flows, dividends, coupon payments, etc. – precious metals tend to benefit during periods of higher volatility. Heightened uncertainty in financial markets due to increasing macroeconomic tensions (like US-China trade) increases the safe haven appeal of gold. On the other hand, decreased volatility tends to harm gold prices.
GVZ (Gold Volatility) Technical Analysis: Daily Price Chart (November 2016 to November 2019) (Chart 1)

Gold volatility (as measured by the Cboe’s gold volatility ETF, GVZ, which tracks the 1-month implied volatility of gold as derived from the GLD option chain) was trading at 10.75, quickly approaching its lowest level since mid-June, which it recently visited in the last week of November.
As such, the typical relationship between gold prices and gold volatility remains strong in the near-term, even if it has loosened in the past few days: the 5-day correlation between GVZ and gold prices is 0.88 while the 20-day correlation is 0.15; in the most recent update, the 5-day correlation was 0.96 and the 20-day correlation was 0.25.
Gold Price Technical Analysis: Daily Chart - Descending Channel (December 2018 to December 2019) (Chart 2)
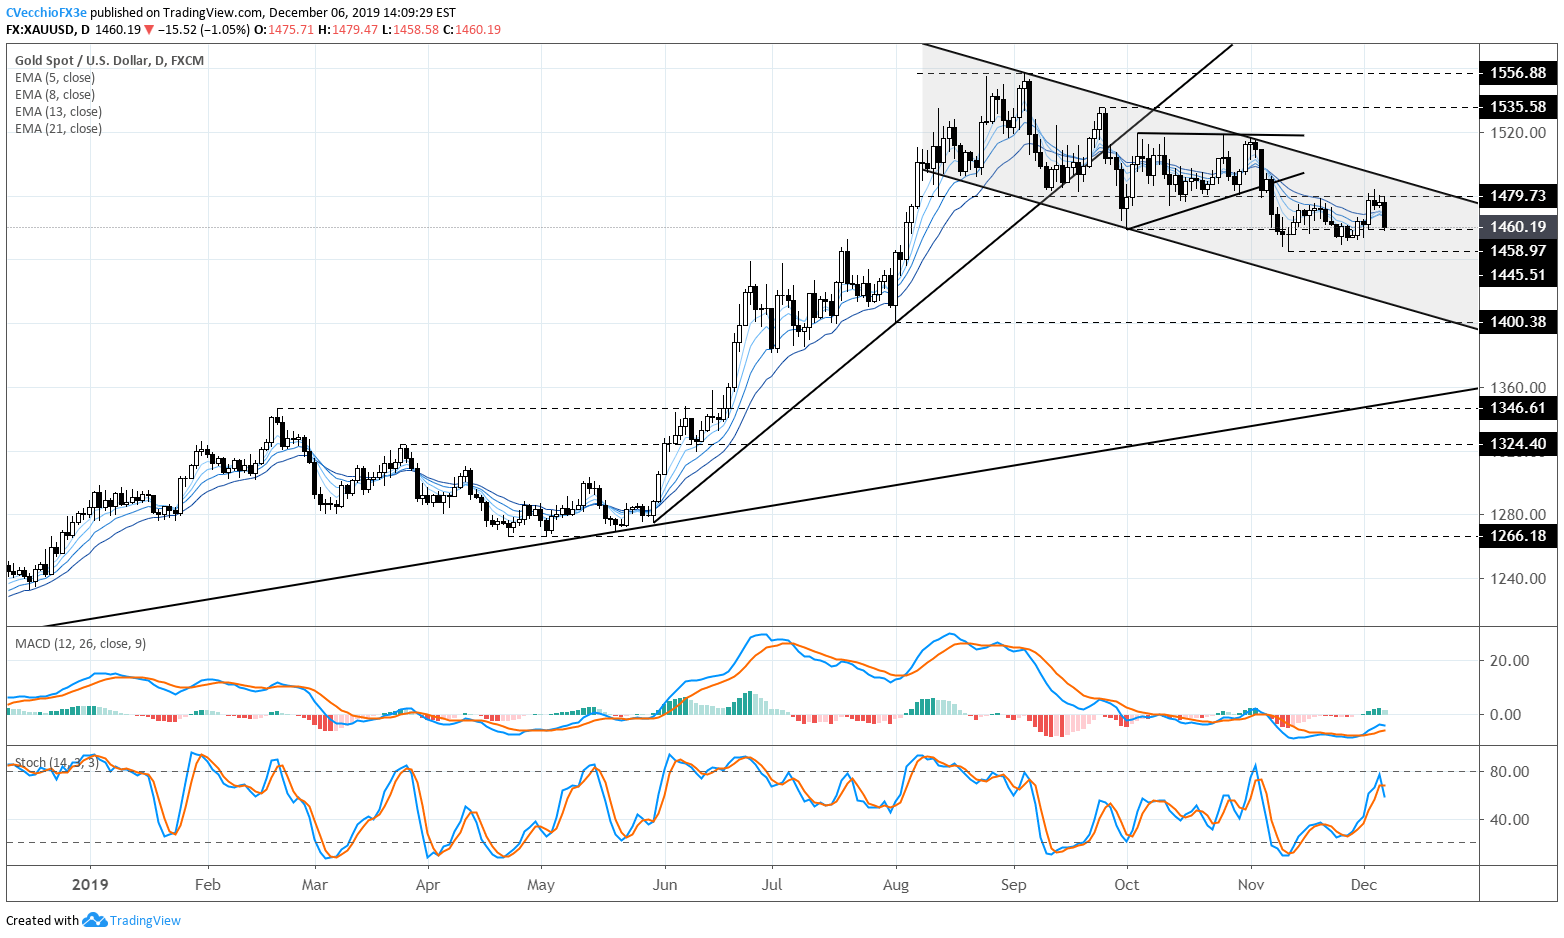
Earlier this week in the latest gold price forecast, it was noted that the outlook suggested “a ‘buy the rumor, sell the news’ type of opportunity as price approaches downtrend resistance.” The descending channel from the September and November highs continues to hold, and the latest rally never even got a chance at reaching downtrend resistance. Underlying fundamental weakness is apparent in the failed attempts to change the technical narrative.
Gold prices are once more below the daily 5-, 8-, 13-, and 21-EMA envelope, but the envelope is not in bearish sequential order. Daily MACD is now starting to shift lower, already in bearish territory; Slow Stochastics have started to turn lower despite remaining in bullish territory.
It still holds that “a move down below 1458.97 increases the odds of a return to the November low at 1445.51.” Gold prices were last spotted at 1460.19.
Gold Price Technical Analysis: Weekly Chart – Inverse Head and Shoulders Pattern (July 2011 to December 2019) (Chart 3)
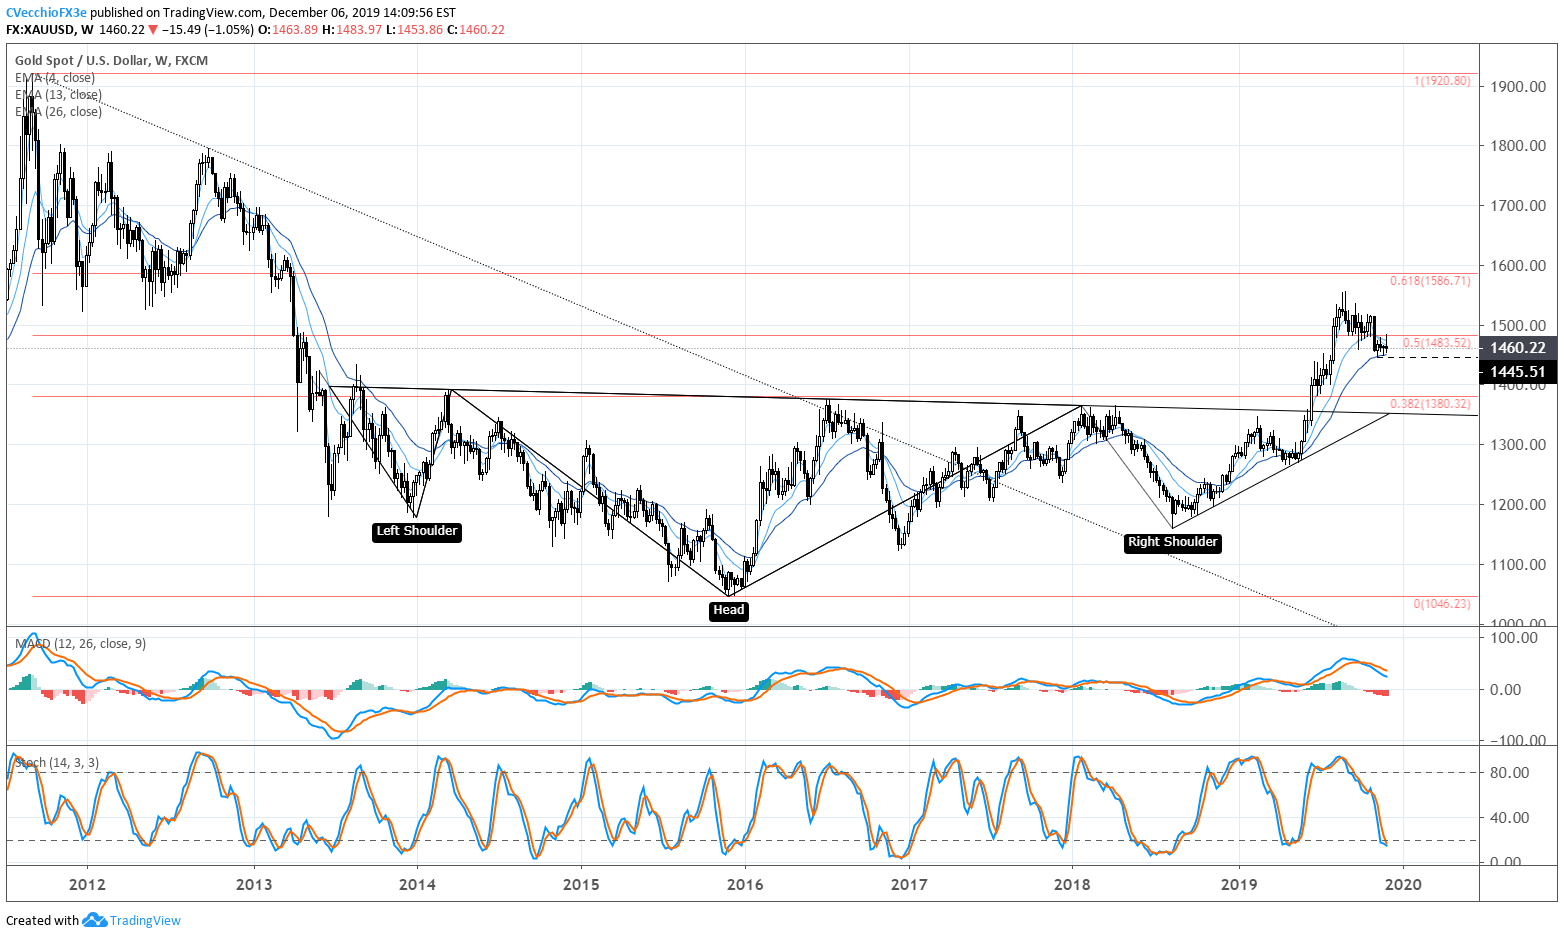
The weekly timeframe moves at a glacial pace, and thus there is no change since the last gold price forecast update. The gold price pullback since the October Fed meeting must be viewed in context of the longer-term technical picture: the gold price inverse head and shoulders pattern that originated earlier this year is still valid. Only a break below the August 1 bullish outside engulfing bar low at 1400.38 would draw into question the longer-term bullish potential.
Depending upon the placement of the neckline, the final upside targets in a potential long-term gold price rally vary: conservatively, drawing the neckline breakout against the January 2018 high at 1365.95 calls for a final target at 1685.67; aggressively, drawing the neckline breakout against the August 2013 high at 1433.61 calls for a final target at 1820.99.
IG Client Sentiment Index: Gold Price Forecast (December 4, 2019) (Chart 4)
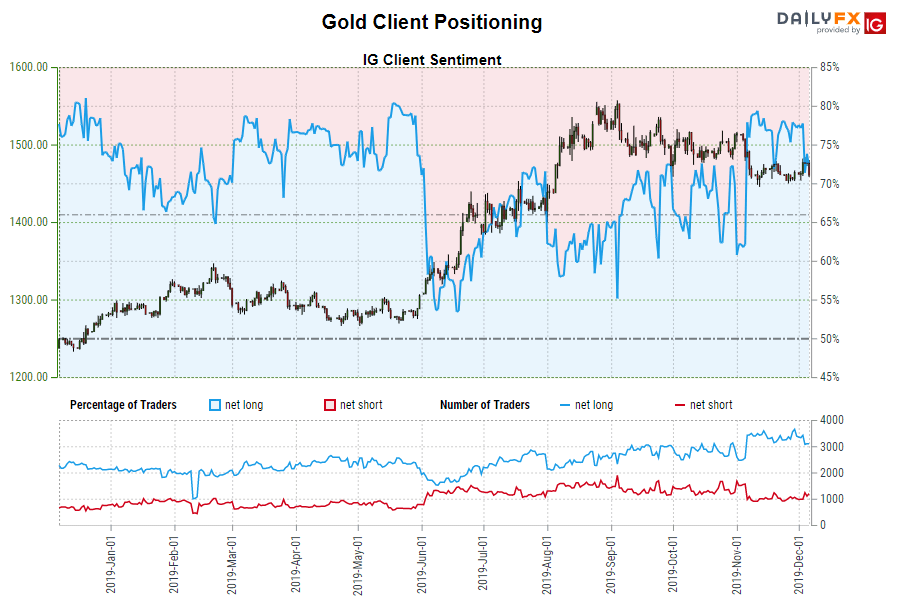
Gold prices: Retail trader data shows 77.8% of traders are net-long with the ratio of traders long to short at 3.51 to 1. The number of traders net-long is 2.8% higher than yesterday and 11.4% lower from last week, while the number of traders net-short is 22.6% lower than yesterday and 8.4% lower from last week.
We typically take a contrarian view to crowd sentiment, and the fact traders are net-long suggests gold prices may continue to fall. Traders are further net-long than yesterday and last week, and the combination of current sentiment and recent changes gives us a stronger gold-bearish contrarian trading bias.
FX TRADING RESOURCES
Whether you are a new or experienced trader, DailyFX has multiple resources available to help you: an indicator for monitoring trader sentiment; quarterly trading forecasts; analytical and educational webinars held daily; trading guides to help you improve trading performance, and even one for those who are new to FX trading.
--- Written by Christopher Vecchio, CFA, Senior Currency Strategist
To contact Christopher Vecchio, e-mail at cvecchio@dailyfx.com
Follow him on Twitter at @CVecchioFX
View our long-term forecasts with the DailyFX Trading Guides


