


Talking Points:
- Gold prices started to pull back last week after an aggressive top-side run.
- Retail traders are still on the long side of Gold, which may be indicating a deeper pullback before that bigger-picture bullish trend is ready for resumption.
- Are you looking to improve your trading approach? Check out Traits of Successful Traders. And if you’re looking for an introductory primer to the Forex market, check out our New to FX Guide.
To receive James Stanley’s Analysis directly via email, please sign up here
Gold Prices Continue to Pull Back as US Yields Rise
Gold prices spent much of last week trending lower after having just set a fresh yearly high in the week prior. As the U.S. Dollar spent most of last year selling-off, Gold benefited dramatically as prices rose from a 2017 open around $1,150 all the way up above $1,350; before closing the year around $1,300. And in the first month of this year, that move largely continued as the Dollar continued to fall even as US Treasury Yields rose, helping Gold prices to set another fresh yearly high around the $1,365 level.
February, however, has been a change-of-pace across global markets; as continued strength in US Yields has started to hit the equity space, and after another hat tip towards stronger inflation at last week’s Non-Farm Payrolls, Gold prices have continued last week’s bearish theme, finding a bit of short-term resistance around a prior swing-low.
Gold Hourly: Lower-High Resistance After Last Week's Sell-Off to Support

Chart prepared by James Stanley
As we open this week, a bevy of headline risk remains, but largely coming from economies outside of the United States. Nonetheless, some of these high-impact events can have a bearing on global risk tolerance which could, of course, impact Gold prices.
The big question for this week given the dearth of US data or drivers is one of a technical nature. As in, will buyers come-in to offer support for the longer-term trend, even in the face of this short-term bearish theme? Thus far, we’ve seen a bit of support develop around a prior swing low around $1,325.96: This price had helped to cauterize support in mid-January before Gold prices moved into those fresh highs. This price came into play on Friday morning after NFP, and so far has seen a buyer response. But the fact that sellers came right back in the early portion of the week brings questions to the viability of this level as near-term support. More interesting, however, given current price action structure are potential supports around $1,316 and $1,307.50. The price of $1,316 had given both a swing-high and a swing-low earlier in January when prices were working their way up, and the level of $1,307.50 did the same around the open of the New Year.
Each of these levels could provide near-term targets for bearish approaches, or potential jumping off points for longer-term bullish approaches should support actually show at either of those levels.
Gold Four-Hour Chart: Resistance at Prior Support
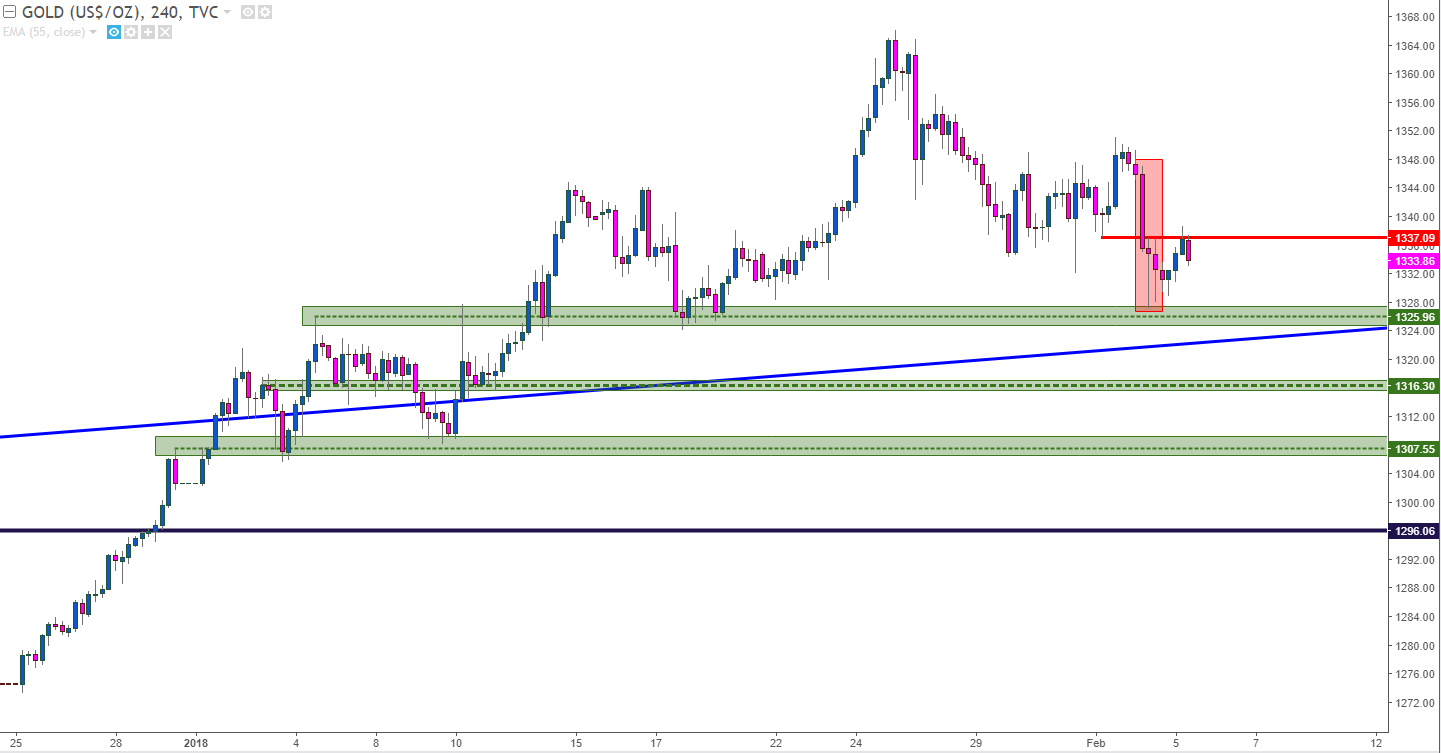
Chart prepared by James Stanley
Gold: Bearish Potential with Head and Shoulders Pattern
There’s another reason that bulls should be careful around $1,325 as a bigger type of reversal or correction may be brewing ahead. Over the past few weeks, a head and shoulders pattern has started to show in Gold’s price action. This is the type of formation that can often print around the top of the move and, at the very least, it brings a bit of additional interest around that $1,325 level as this is the approximate area of the neckline of the formation. If the neckline cannot hold support, look out below.
Gold Hourly: Head and Shoulders Pattern
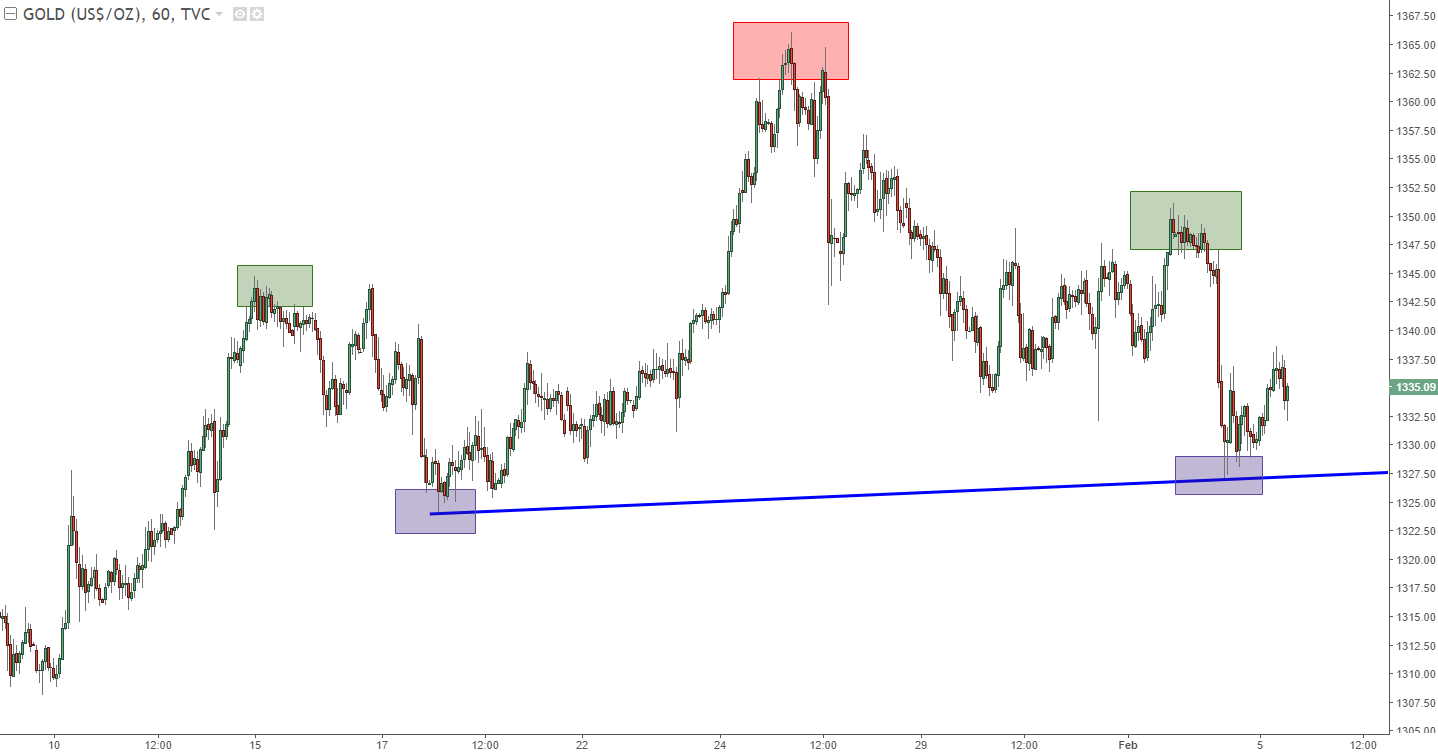
Chart prepared by James Stanley
A head and shoulder pattern will usually be traded with a target that is somewhat based on the distance from the top of the head to the neckline, which in this case is approximately $40. Projecting that below current price action would put us around $1,287, which would require traveling through a number of support levels first. Instead, traders looking at the bearish side of Gold prices can look to prior supports for scales on the exit of profitable bearish positions. This could be worked with at the levels mentioned above, combined with psychological support around $1,300, and then $1,296, which was the double top from last year.
The 61.8% Fibonacci retracement of the bullish move that started in December rests at $1,286.35, and this could be used as a final profit target for the bearish projection of that head and shoulders pattern above.
Gold Daily Chart: Potential Supports, Downside Targets Applied
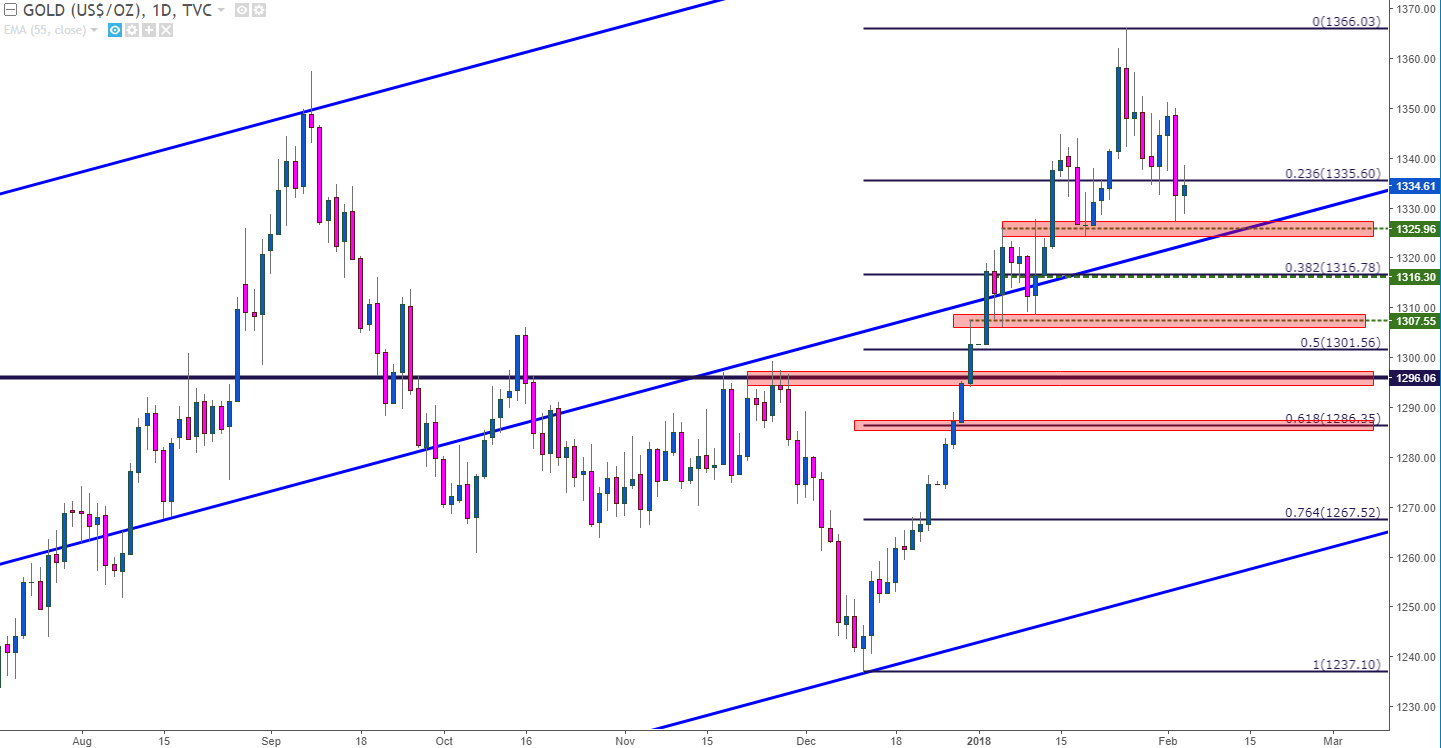
Chart prepared by James Stanley
To read more:
Are you looking for longer-term analysis on Gold prices? Our DailyFX Forecasts for Q1 have a section specifically for Gold. We also offer a plethora of resources on our Gold page, and traders can stay up with near-term positioning via our IG Client Sentiment Indicator.
Chart prepared by James Stanley
--- Written by James Stanley, Strategist for DailyFX.com
To receive James Stanley’s analysis directly via email, please SIGN UP HERE
Contact and follow James on Twitter: @JStanleyFX


