


Talking Points:
- Gold Prices have posed a bullish move over the past two weeks after oversold conditions began to flash.
- A key zone of support around $1,250 was unable to hold the lows, and this can open the door to short-side strategies.
- If you’re looking for trading ideas, check out our Trading Guides. And if you’re looking for ideas that are more short-term in nature, please check out our IG Client Sentiment.
To receive James Stanley’s analysis directly via email, please SIGN UP HERE
In our last article, we looked at the bullish move in Gold prices after oversold conditions began to flash in the early portion of July. That downtrend in Gold lasted more than a month and saw more than $90 leave the market; but after support showed up around the $1,205 level, buyers began to take control and prices moved-higher in a relatively consistent channel, creating a bear flag formation as we can see on the chart below:
Gold: Four-Hour Chart, Bear Flag Formation Shown with Blue Trend-Channel
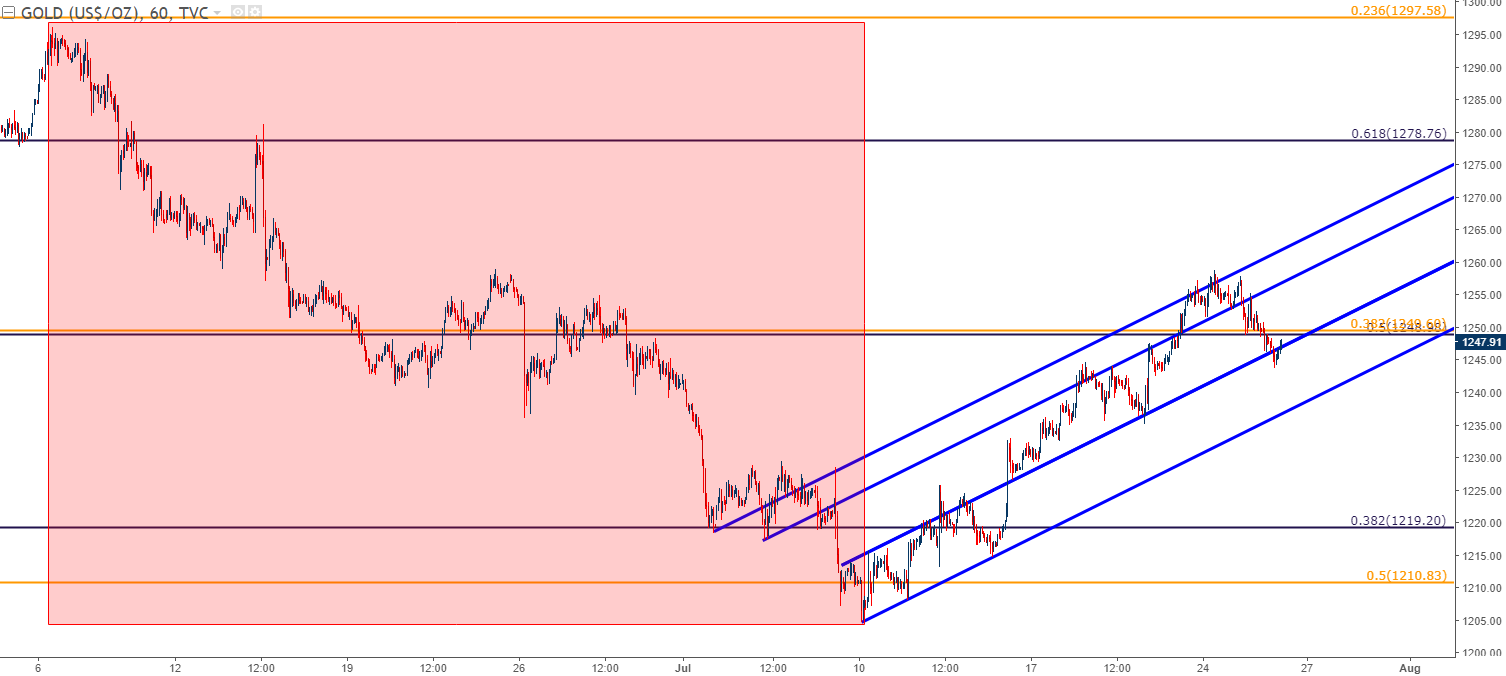
Chart prepared by James Stanley
As we also discussed in our last article, the price zone around $1,250 is crucial to near-term price action in Gold. Within a $2-range on the chart, we have three Fibonacci retracement levels from three relevant major moves. At $1,250.35 we have the 50% retracement of the most recent bearish move, taking the June high down to the July low. At $1,249.98, we have the 50% retracement of the July-December, 2016 major move, and at $1,249.60, we have the 38.2% retracement of the December 2015 – July 2016 major move.
Perhaps more importantly, this confluent zone of support has offered numerous inflections and swings for recent price action in Gold, including helping to set swing support on the night of Brexit.
Gold Daily Chart: Confluent Support Zone Around $1,250 Emphasized
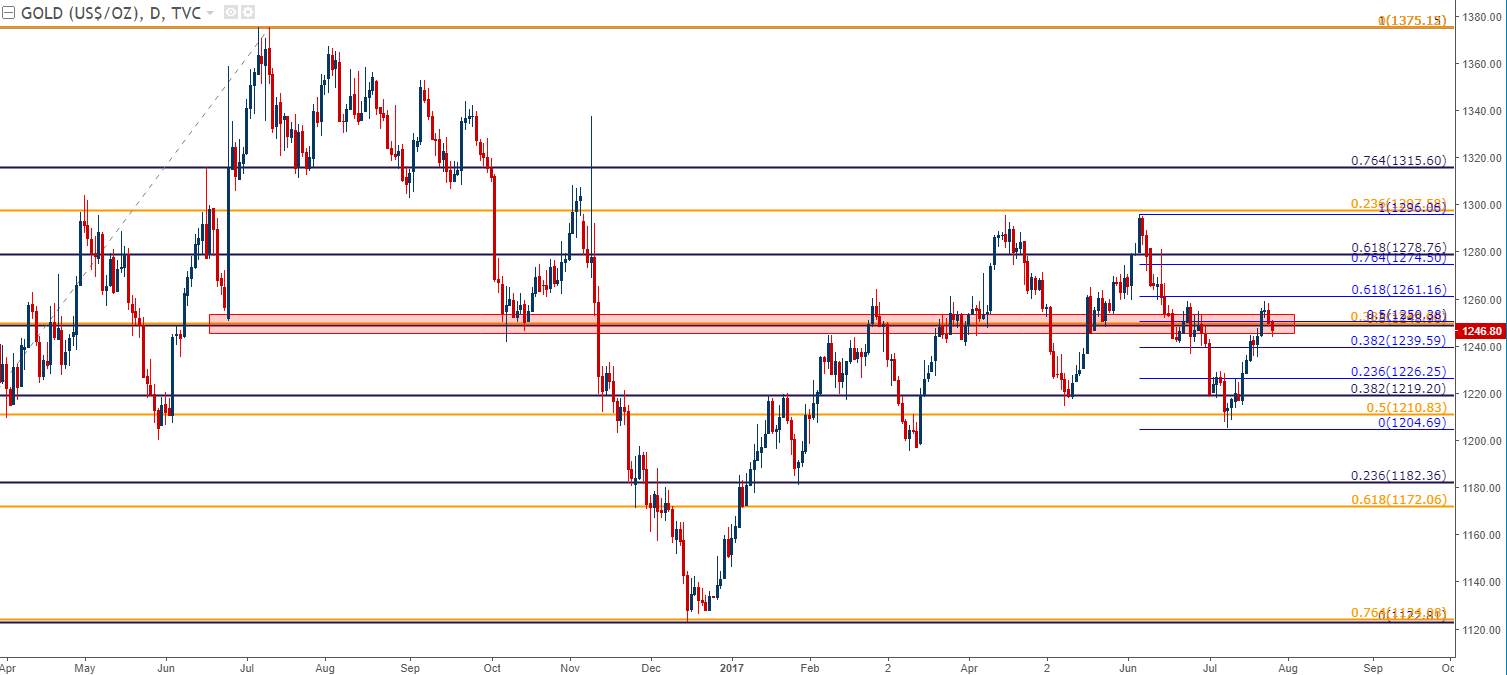
Chart prepared by James Stanley
To make matters more interesting, the bearish move that drove Gold prices-lower through most of June and into July was also happening as the U.S. Dollar was selling-off. Gold prices began to rise around July 10th, which is right around the time that the Greenback went into freefall mode ahead of Janet Yellen’s Humphrey Hawkins testimony. But over the past 24 hours, we’ve started to see a bit of strength develop in the Dollar, and as we wrote yesterday, that market is extremely oversold. As that strength has started to show in USD, Gold prices have tilted-lower, unable to hold support at this confluent zone around the $1,250-zone.
Gold: Hourly, Support Zone around $1,250 Unable to Hold the Lows
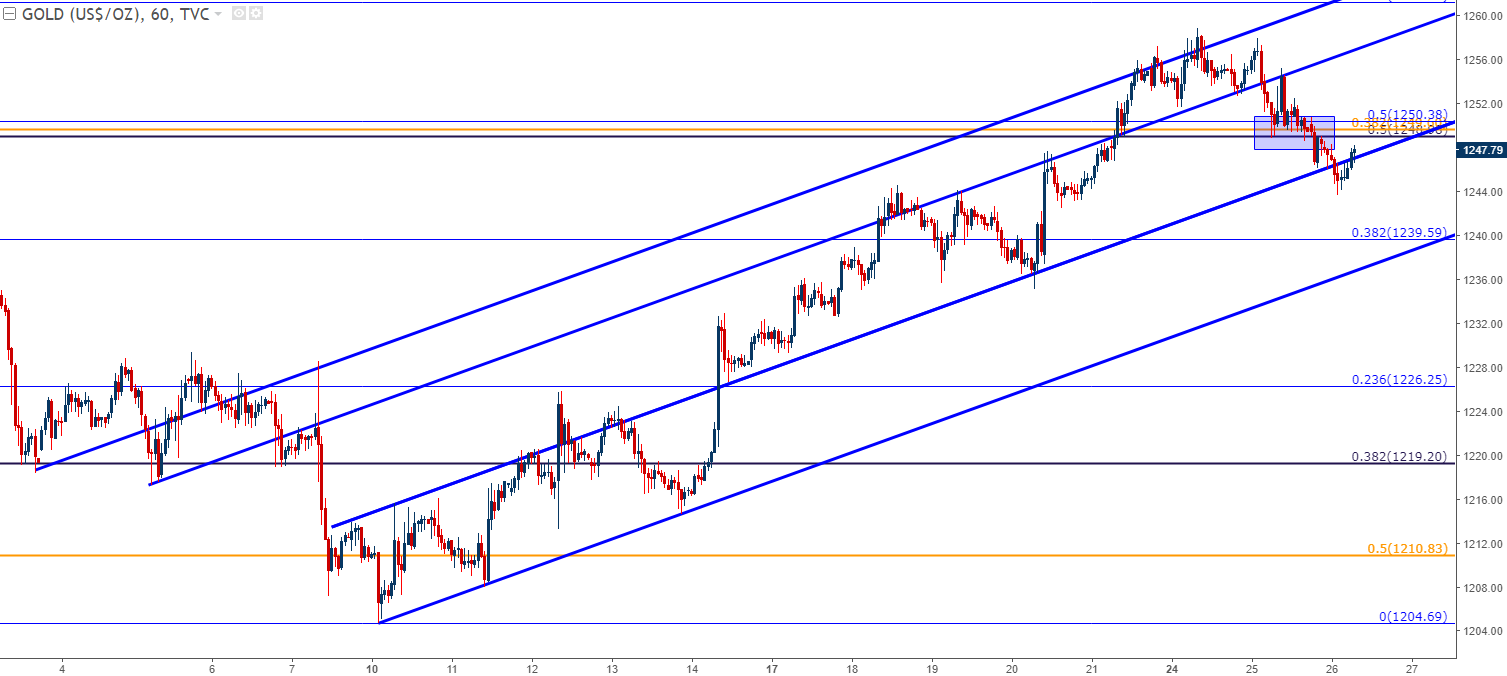
Chart prepared by James Stanley
Given this break of support, the door can be opened to short-side plays for aggressive strategies. Traders can look for stop placement at resistance swings around $1,255 or $1,259. Targets for aggressive strategies can look towards prior support zones of $1,241, $1,236 and then $1,226. For traders looking to treat Gold a bit more conservatively, they can await a break below this bullish trend channel as further evidence that the bear flag will give way.
--- Written by James Stanley, Strategist for DailyFX.com
To receive James Stanley’s analysis directly via email, please SIGN UP HERE
Contact and follow James on Twitter: @JStanleyFX


