


Talking Points:
- Gold technical strategy: Bullish trend-channel producing bear flag formation.
- IG Client Sentiment is currently showing +4.78 traders long for every one short, and given retail sentiment’s contrarian nature, this is bearish.
- Q3 Forecasts have just been released and are available in our Trading Guides. And if you’re looking for something more interactive in nature, please check out our DailyFX Live webinars.
To receive James Stanley’s Analysis directly via email, please sign up here.
In our last article, we looked at the precipitous downtrend in Gold prices running into oversold territory. After a month of selling drove prices lower by more than $90, sellers abated after price action found support north of the $1,200 psychological level. And over the past week, Gold prices have rallied in a rather consistent fashion, producing a bullish trend-channel. Given that this bullish trend channel is showing up near the bottom of a bearish move, we can call this a bear flag formation:
Gold Prices Hourly Chart – Bullish Trend Channel Past Week
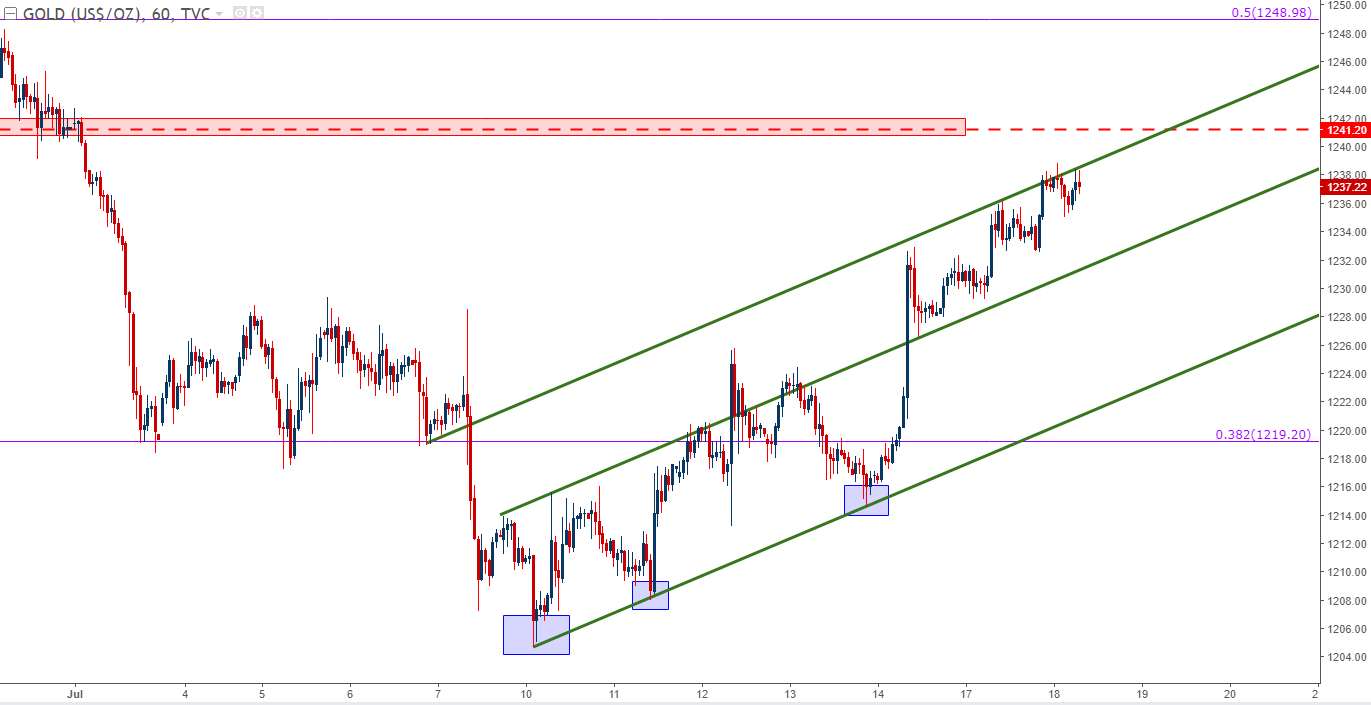
Chart prepared by James Stanley
At this stage, the bullish move has yet to retrace 38.2% of that prior down-trend, and given the consistency with which bulls have re-entered the market to produce this rather clean channel, and traders looking to take on bearish exposure will likely want to let prices rise a bit more before looking to take short-side entries. Using the Fibonacci retracement applied to the most recent bearish move, taking the high from early-June down to the July lows, and two additional areas become interesting for potential resistance.
Gold Prices four-hour chart, emphasis on Fibonacci retracement levels
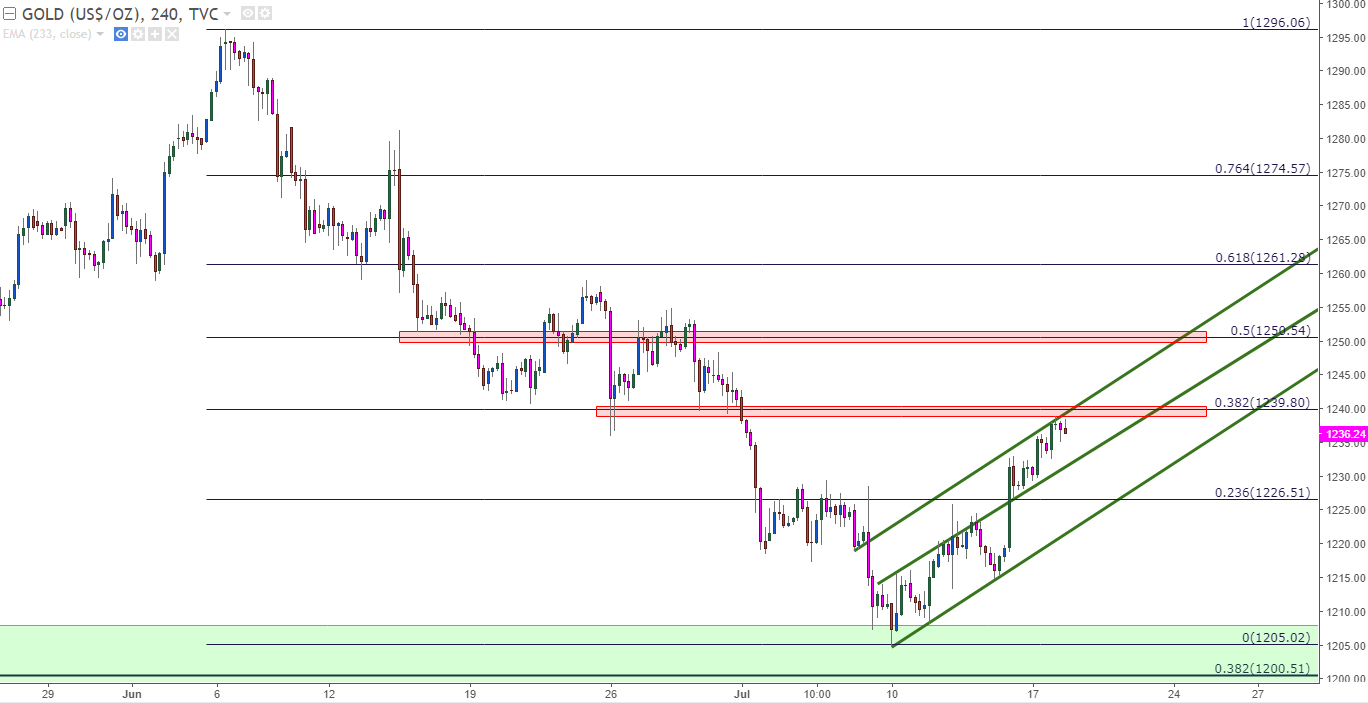
Chart prepared by James Stanley
The level around $1,250 is particularly interesting as potential resistance. At $1,248.98 we also have the 50% retracement of the July-December 2016 move, and this area has come-in as support and/or resistance numerous times over the past year. This level had helped to mark the ‘swing low’ around the Brexit referendum last year and, should resistance begin to show around this area again, the door can be opened to short-side swing approaches.
Gold Prices Daily Chart – Confluence of Resistance Around $1,250
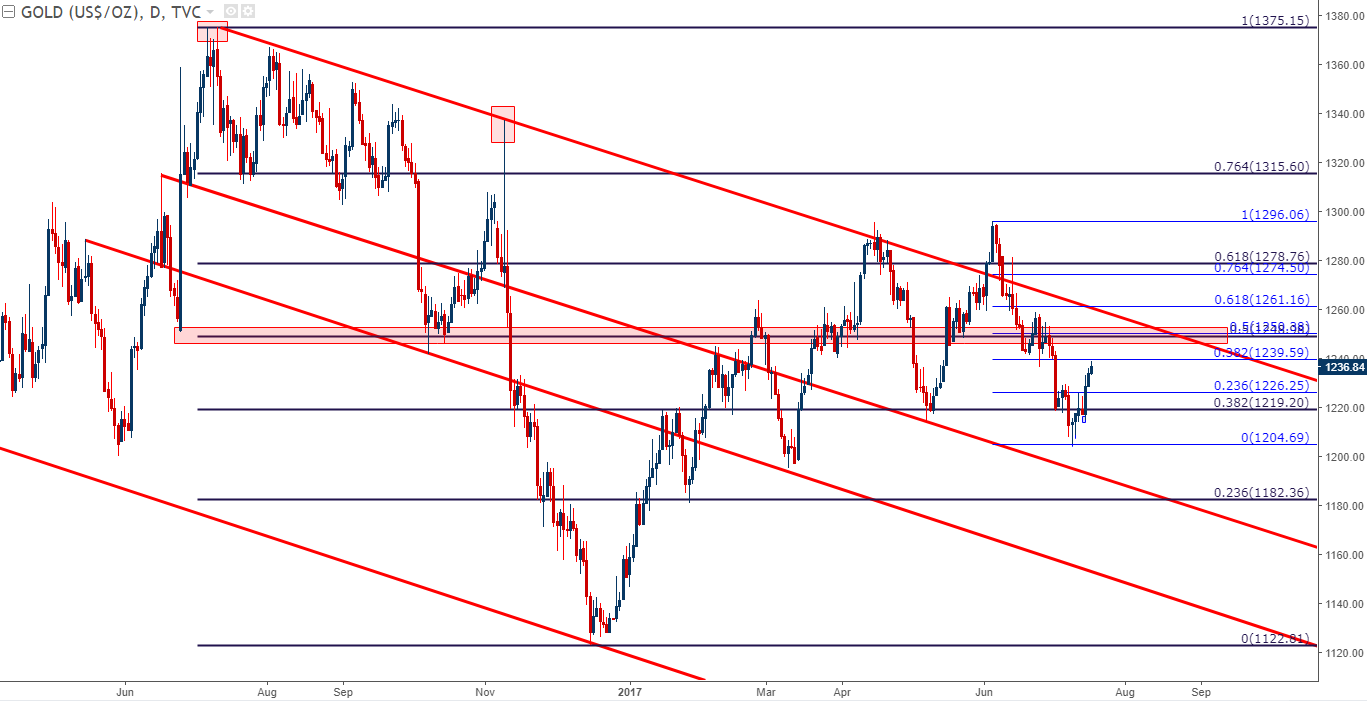
Chart prepared by James Stanley
--- Written by James Stanley, Strategist for DailyFX.com
To receive James Stanley’s analysis directly via email, please SIGN UP HERE
Contact and follow James on Twitter: @JStanleyFX


