


Talking Points:
- Gold technical strategy: Long-term mixed, Intermediate-term bearish, short-term bearish.
- FOMC Minutes are released later today at 2PM ET, and Friday brings Non-Farm Payrolls. The U.S. Dollar will likely remain volatile around these key events.
- IG Client Sentiment is currently showing +4.99 traders long for every one short, and given retail sentiments contrarian nature, this is bearish.
- If you’re looking for trading ideas, check out our Trading Guides. If you’re looking for shorter-term ideas or trading education, please check out our DailyFX Webinars.
To receive James Stanley’s Analysis directly via email, please sign up here.
On Monday, we looked at the aggressive bearish run that’s taking place in Gold prices. Throughout Monday, that bearish move continued to develop, and prices ran down-below the $1,220-handle Gold dropped by the most in seven months – since the night of the U.S. Presidential election.
But mid-day on Monday, Gold prices found support at a key zone around $1,219. This is the 38.2% Fibonacci retracement of the July-December 2016 major move, and the 50% marker of that same move helped to set resistance last week before the selling in Gold really heated up. This level had also helped to set the lows in Gold prices in early-May; and that’s right around the time that James Comey was fired, and Gold prices rallied all the way to his testimony in front of the Senate a month later. Around that testimony – Gold prices resisted at the April high to produce a double top formation – and since then Gold prices have been heavily offered through a litany of support levels.
Gold Daily Chart with Fibonacci Retracement Applied – Support Highlighted
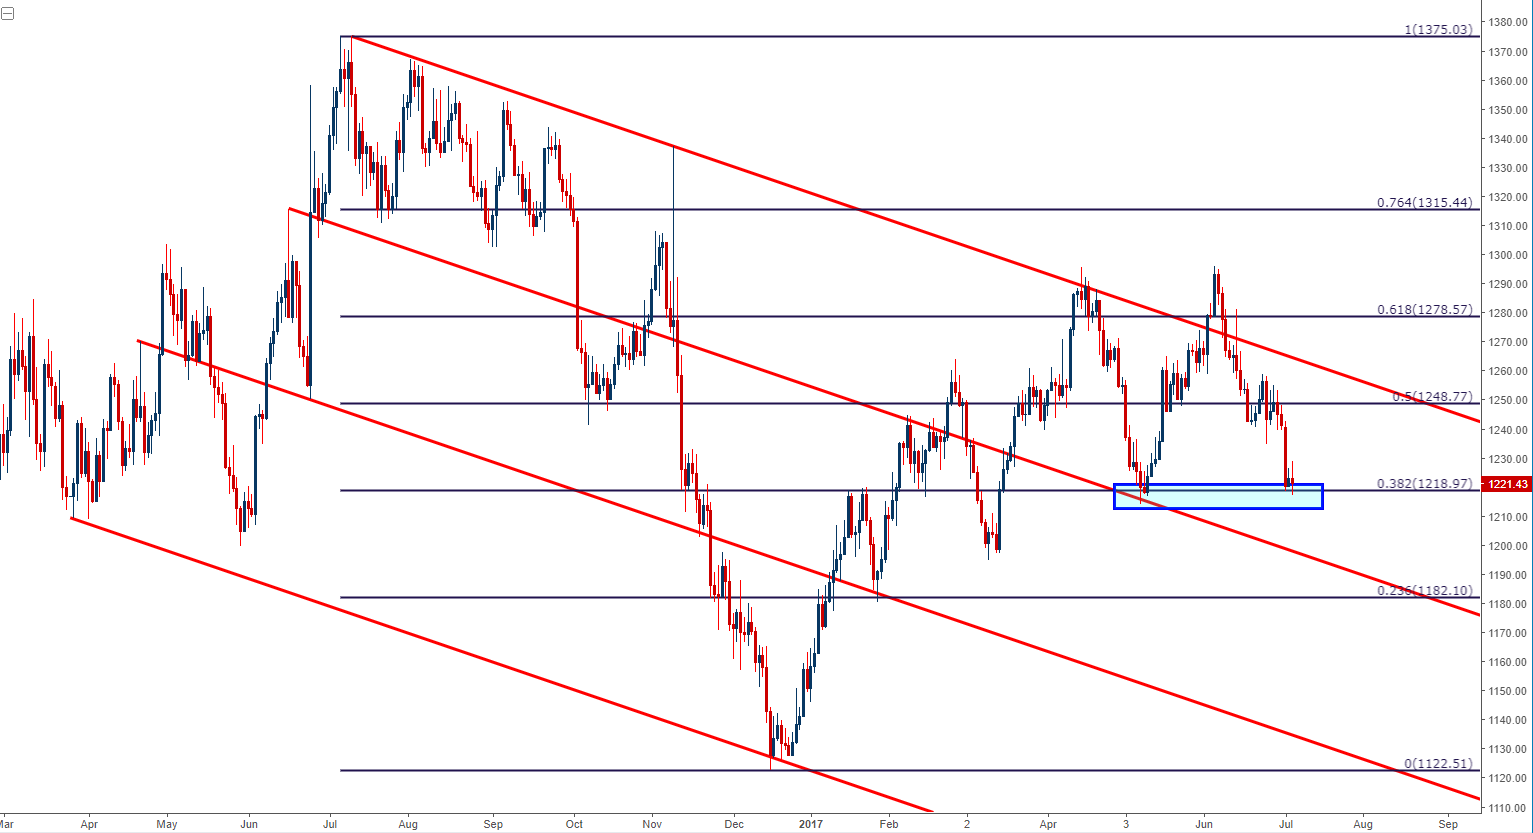
Chart prepared by James Stanley
Is the Bearish Run Complete?
There is no evidence yet to suggest as such. There have been no clear shifts on a fundamental basis, nor have there been any technical events that would denote the end of the bearish trend. This would allow traders to move-forward with a bearish bias for Gold prices. IG Client Sentiment is currently showing +4.99-to-1, which is bearish given retail sentiment’s contrarian nature.
The matter of complication at the moment is the issue of re-entry. The remainder of this week brings some rather pertinent U.S. data with the release of FOMC minutes later this afternoon followed by Non-Farm Payrolls on Friday, and since Gold prices ran into support around $1,219, sellers have been unable to re-take control of price action. Add this to the fact that we had a fairly out-sized spill to begin the week, and we may need more of a pullback before short-side re-entry becomes attractive again.
On the hourly chart below, we’re looking at four potential resistance areas that can be used in the effort of bearish continuation. If price action breaks-above the swing-high around $1,259, the bearish approach will no longer be as attractive, and this can be an area to investigate for stop placement should the zone around the ‘r4’ level become tested.
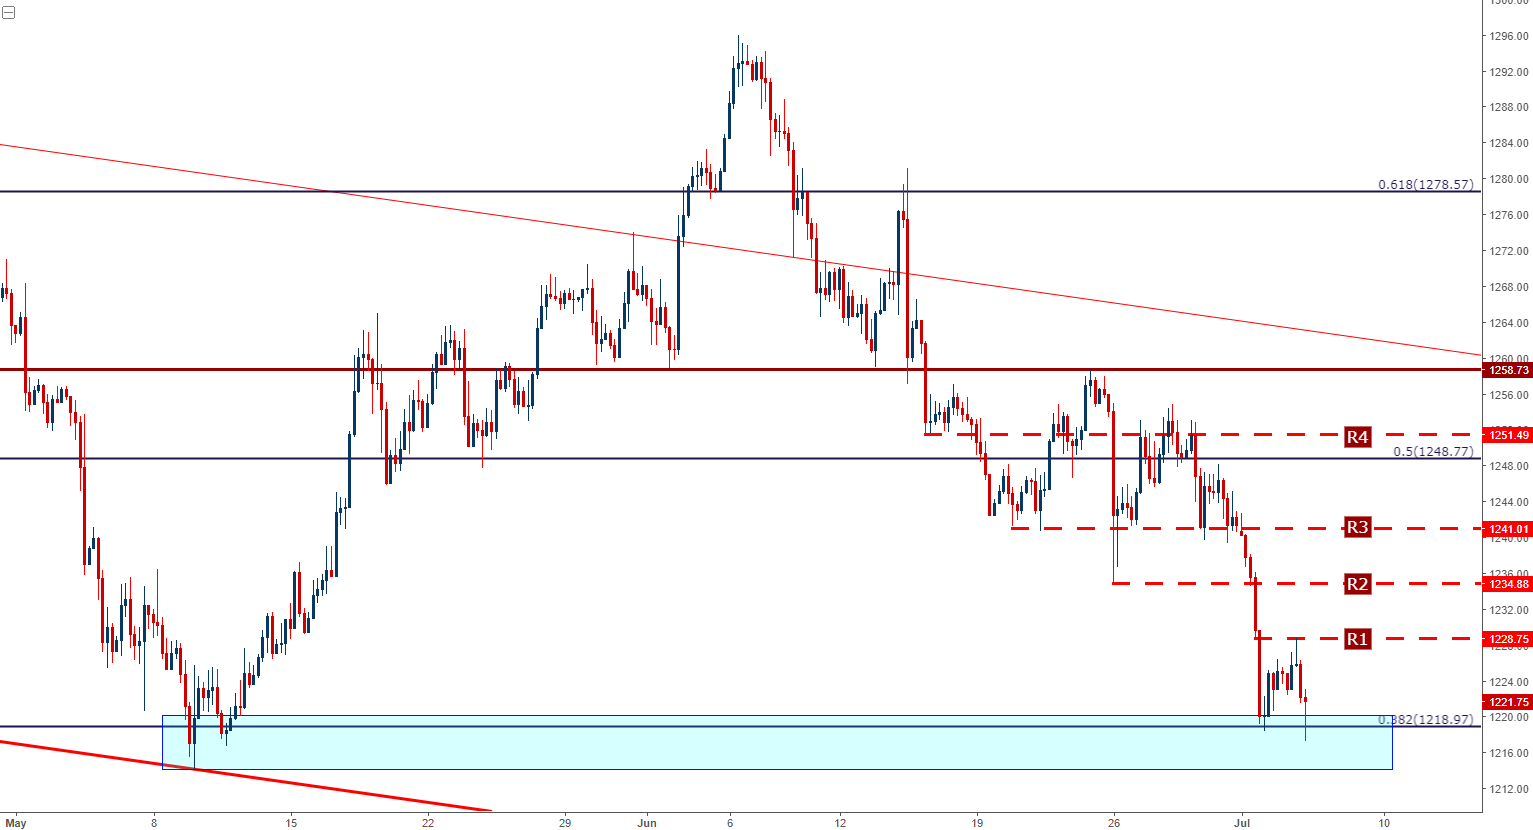
Chart prepared by James Stanley
--- Written by James Stanley, Strategist for DailyFX.com
To receive James Stanley’s analysis directly via email, please SIGN UP HERE
Contact and follow James on Twitter: @JStanleyFX


