


Silver Price Outlook:
- Silver prices traded below the 61.8% Fibonacci retracement of the 2020 low/2021 high range.
- Having broken through 18.7064, a more significant sell-off towards 16.000 may still be in the works.
- However, recent changes in sentiment suggest that silver prices have a mixed bias in the near-term.
Rate Hikes and Recession Fears
Once again, silver prices established a fresh yearly low today, a continuation of the sell-off spurred following the symmetrical triangle bearish breakout in the second half of June. The grey metal barreled through 18.7064, a key level outlined at the end of June, suggesting that an even deeper setback is still unfolding.
The fundamental side of the equation hasn’t changed. “The ongoing rise in US real yields – nominal US Treasury yields less US inflation expectations (as measured by breakevens and inflation swap forwards) – coupled with global recession concerns has curated a difficult environment for silver prices.” A weak fundamental narrative continues to underpin an equally weak technical outlook.

Silver Prices and Volatility Relationship Erodes
Both gold and silver are precious metals that typically enjoy a safe haven appeal during times of uncertainty in financial markets. While other asset classes don’t like increased volatility (signaling greater uncertainty around cash flows, dividends, coupon payments, etc.), precious metals tend to benefit from periods of higher volatility as uncertainty increases silver’s safe haven appeal. A lackluster volatility environment in US equities isn’t doing much for silver prices in the near-term.
VIX (US S&P 500 VOLATILITY) versus Silver Price TECHNICAL ANALYSIS: DAILY PRICE CHART (July 2021 to July 2022) (CHART 1)
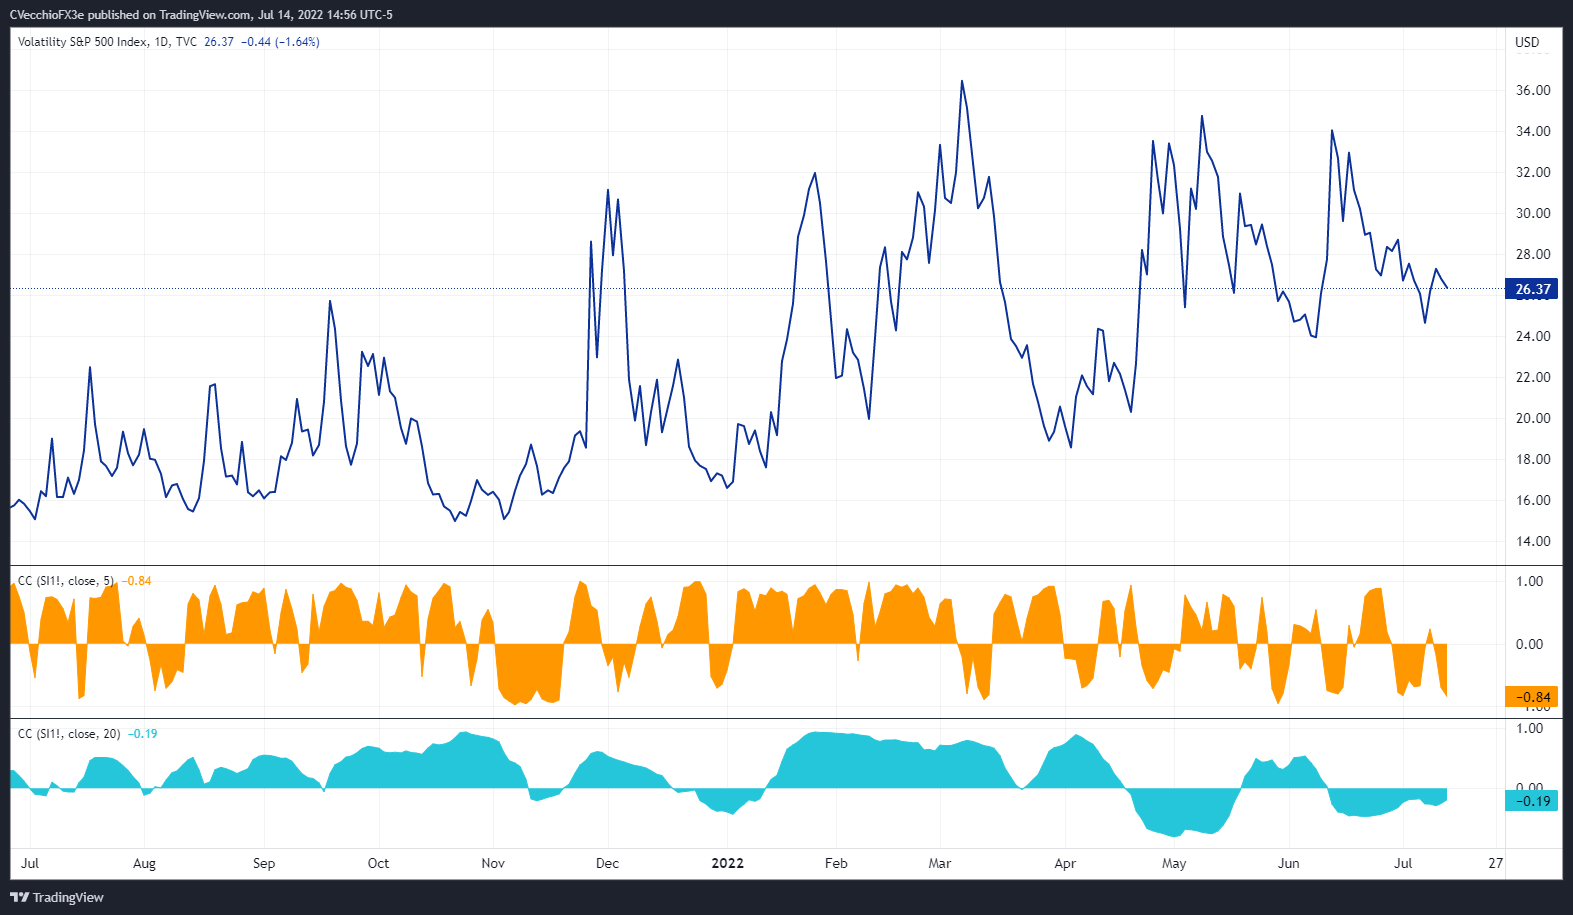
US stock market volatility (as measured by the US S&P 500 volatility index, VIX, which tracks the stock market's expectation of volatility based on S&P 500 index options) was trading at 26.33 at the time this report was written. The 5-day correlation between the VIX and silver prices is -0.84 and the 20-day correlation is -0.19. One week ago, on July 7, the 5-day correlation was -0.67 and the 20-day correlation was -0.17.
SILVER PRICE TECHNICAL ANALYSIS: DAILY CHART (July 2020 to July 2022) (CHART 2)
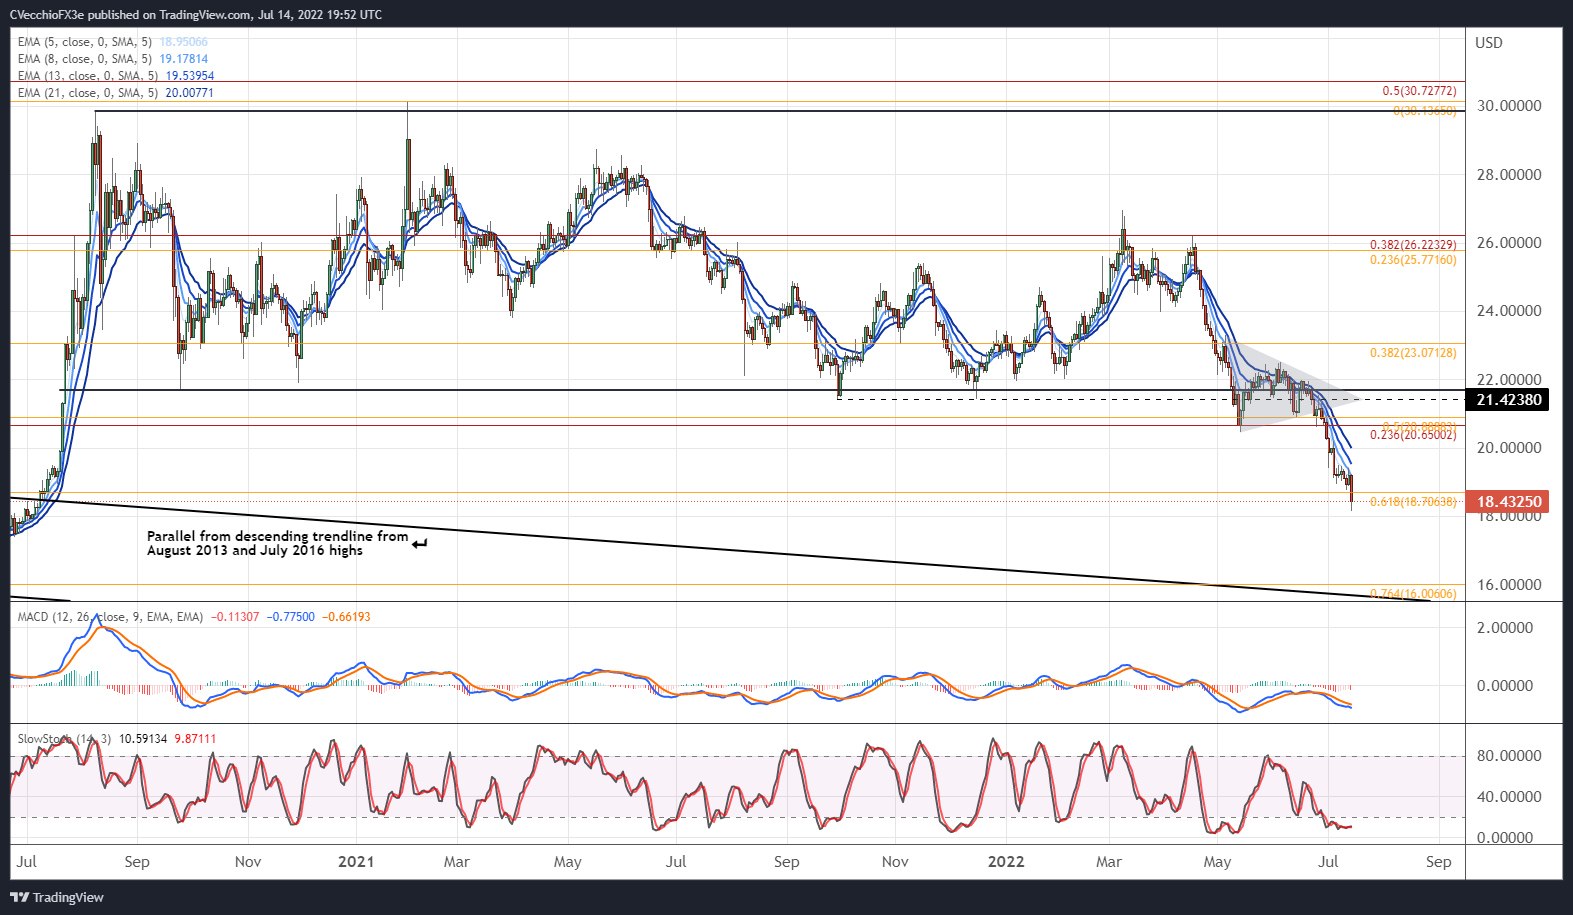
With a new 2022 low on the books, silver prices fulfilled an expectation outlined at the end of June: “a move towards the 61.8% Fibonacci retracement of the 2020 low/2021 high range at 18.7064.” The sell-off in silver prices is consistent with the symmetrical triangle bearish breakout a few weeks ago, given that the preceding direction was to the downside. Momentum retains its bearish hue. Silver prices are below their daily 5-, 8-, 13-, and 21-EMA envelope, which is in bearish sequential order. Daily MACD continues to fall while below its signal line, and daily Slow Stochastics are holding in oversold territory. A ‘sell the rally’ perspective remains appropriate for the foreseeable future.
SILVER PRICE TECHNICAL ANALYSIS: WEEKLY CHART (November 2010 to July 2022) (CHART 3)
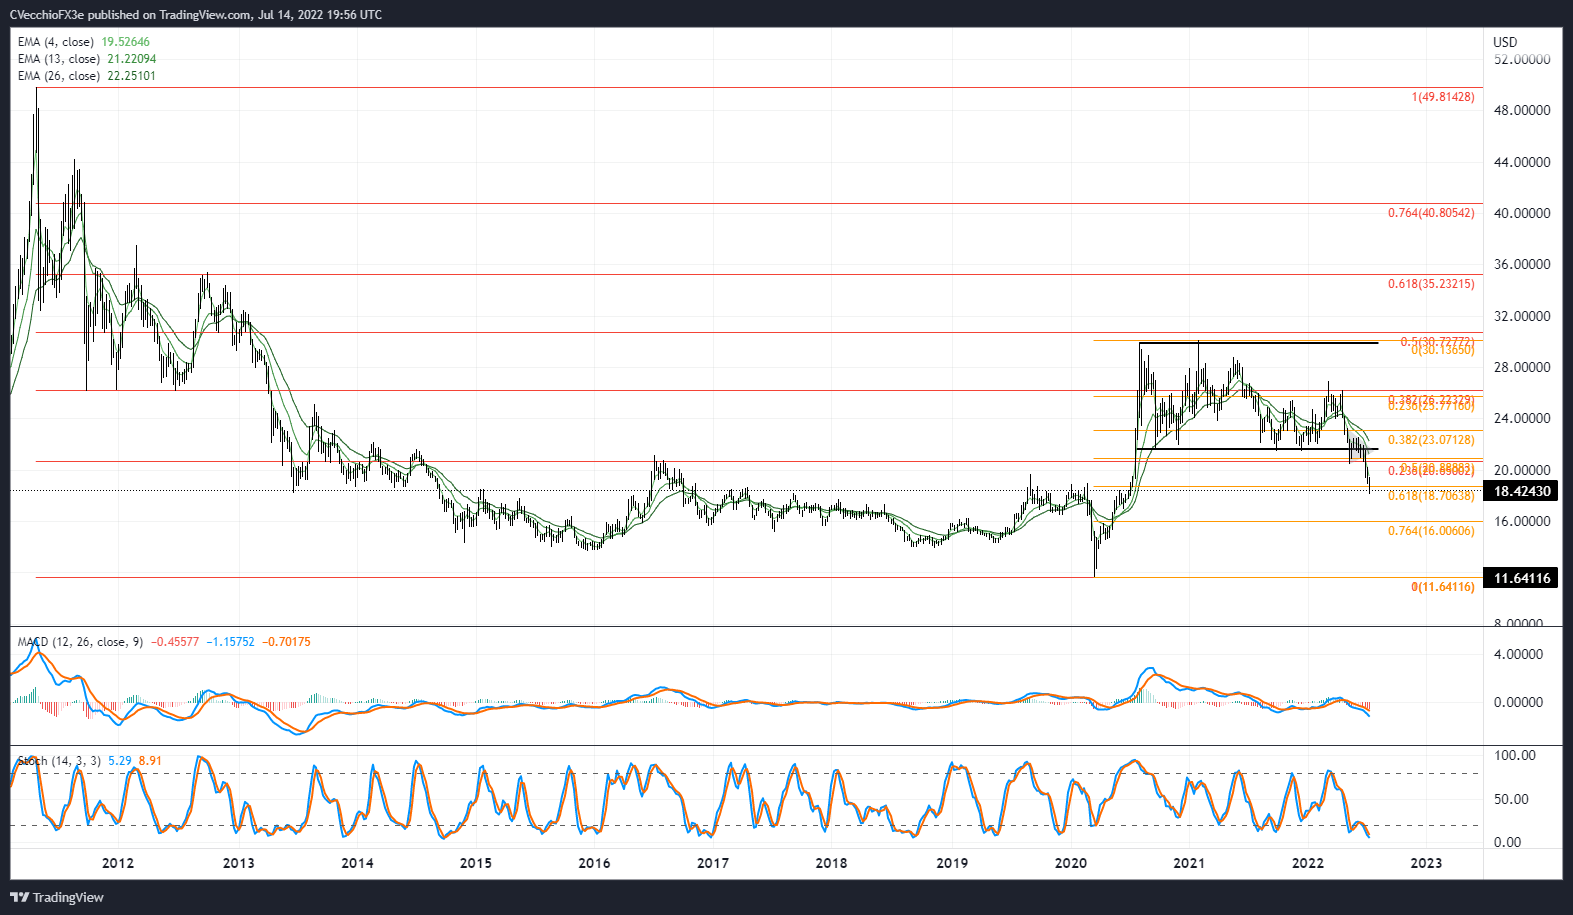
Having broken the 61.8% Fibonacci retracement of the 2020 low/2021 high range at 18.7064, a more significant reversal may still transpire yet. The next level lower would the 76.4% Fibonacci retracement at 16.0061. Silver prices are below their weekly 4-, 8-, and 13-EMAs, and the EMA envelope is aligned in bearish sequential order. Weekly MACD is trending lower below its signal line, while weekly Slow Stochastics remain in oversold territory. It holds that “confidence remains high in the idea that the path of least resistance is lower.”
IG CLIENT SENTIMENT INDEX: SILVER PRICE FORECAST (July 14, 2022) (CHART 4)
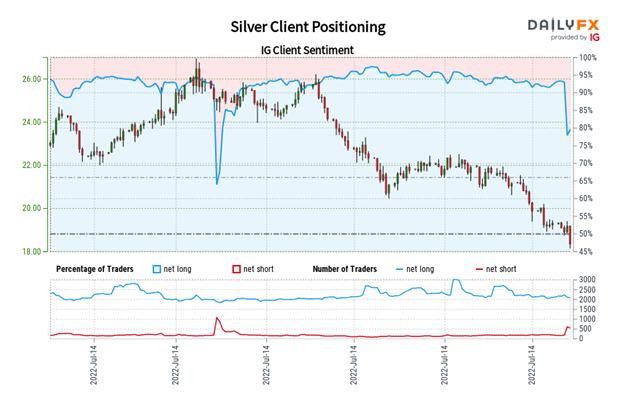
Silver: Retail trader data shows 80.04% of traders are net-long with the ratio of traders long to short at 4.01 to 1. The number of traders net-long is 0.62% lower than yesterday and 0.24% higher from last week, while the number of traders net-short is 8.26% lower than yesterday and 214.46% higher from last week.
We typically take a contrarian view to crowd sentiment, and the fact traders are net-long suggests Silver prices may continue to fall.
Positioning is more net-long than yesterday but less net-long from last week. The combination of current sentiment and recent changes gives us a further mixed Silver trading bias.
Trade Smarter - Sign up for the DailyFX Newsletter
Receive timely and compelling market commentary from the DailyFX team
--- Written by Christopher Vecchio, CFA, Senior Strategist


