


Silver Price Outlook:
- Silver prices broke out of multi-week symmetrical triangle to the downside as anticipated, falling to fresh yearly lows.
- A steeper drop towards 18.7064 may be in its early stages.
- However, recent changes in sentiment suggest that silver prices have a bullish bias in the near-term.
Fundamentals Spur Technical Breakdown
Silver prices established a fresh yearly low today, continuing a stretch of sharp selling pressures after the symmetrical triangle noted last week gave way. These are the lowest levels seen since July 2020, and there’s little reason to think that the worst is over yet.
It remains the case that fundamental headwinds remain significant. The ongoing rise in US real yields – nominal US Treasury yields less US inflation expectations (as measured by breakevens and inflation swap forwards) – coupled with global recession concerns has curated a difficult environment for silver prices. Accordingly, nothing has changed: the “weak fundamental narrative for silver prices underpins a still-weak technical outlook.”

Silver Prices and Volatility Relationship Flips
Both gold and silver are precious metals that typically enjoy a safe haven appeal during times of uncertainty in financial markets. While other asset classes don’t like increased volatility (signaling greater uncertainty around cash flows, dividends, coupon payments, etc.), precious metals tend to benefit from periods of higher volatility as uncertainty increases silver’s safe haven appeal. It may take another surge in US equity market volatility for silver prices to find some stability in the short-term.
VIX (US S&P 500 VOLATILITY) versus Silver Price TECHNICAL ANALYSIS: DAILY PRICE CHART (June 2021 to June 2022) (CHART 1)

US stock market volatility (as measured by the US S&P 500 volatility index, VIX, which tracks the stock market's expectation of volatility based on S&P 500 index options) was trading at 28.87 at the time this report was written. The 5-day correlation between the VIX and silver prices is -0.79 and the 20-day correlation is -0.32. One week ago, on June 23, the 5-day correlation was +0.85 and the 20-day correlation was -0.46.
SILVER PRICE TECHNICAL ANALYSIS: DAILY CHART (June 2021 to June 2022) (CHART 2)

In setting a fresh 2022 low today, silver prices broke through a confluence of Fibonacci retracements that help gird the prior yearly low back in May. This was anticipated, as in last week’s commentary it was noted that “the consolidation that’s emerged has taken the shape of a symmetrical triangle. In context of the preceding move to the downside, the triangle’s favored breakout direction would be lower.”
Momentum has taken a turn to the downside. Silver prices are below their daily 5-, 8-, 13-, and 21-EMA envelope, which is in bearish sequential order. Daily MACD is now falling while below its signal line, and daily Slow Stochastics are back in oversold territory. A ‘sell the rally’ perspective remains appropriate.
SILVER PRICE TECHNICAL ANALYSIS: WEEKLY CHART (November 2010 to June 2022) (CHART 3)

As noted previously, “a drop below the 23.6% Fibonacci retracement of the 2011 high/2020 low range at 20.6500 would offer a strong confirmation signal that the next leg lower has begun.” Concurrently, this may mean that a move towards the 61.8% Fibonacci retracement of the 2020 low/2021 high range at 18.7064 has begun. Silver prices below their weekly 4-, 8-, and 13-EMAs, and the EMA envelope is aligned in bearish sequential order. Weekly MACD is trending lower below its signal line, while weekly Slow Stochastics are back in oversold territory. Confidence remains high in the idea that the path of least resistance is lower.
IG CLIENT SENTIMENT INDEX: SILVER PRICE FORECAST (June 30, 2022) (CHART 4)
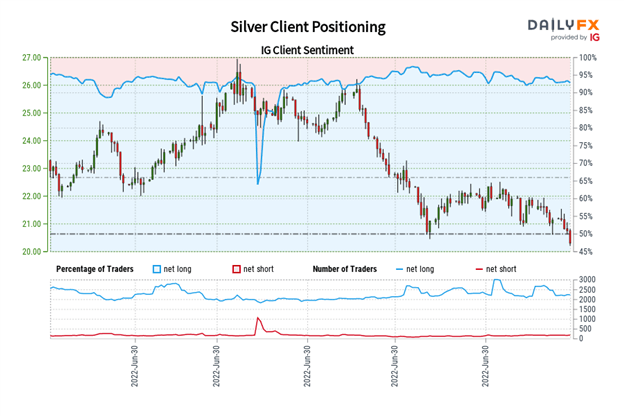
Silver: Retail trader data shows 91.29% of traders are net-long with the ratio of traders long to short at 10.49 to 1. The number of traders net-long is 4.55% lower than yesterday and 14.77% lower from last week, while the number of traders net-short is 16.76% higher than yesterday and 31.17% higher from last week.
We typically take a contrarian view to crowd sentiment, and the fact traders are net-long suggests Silver prices may continue to fall.
Yet traders are less net-long than yesterday and compared with last week. Recent changes in sentiment warn that the current Silver price trend may soon reverse higher despite the fact traders remain net-long.
Trade Smarter - Sign up for the DailyFX Newsletter
Receive timely and compelling market commentary from the DailyFX team
--- Written by Christopher Vecchio, CFA, Senior Strategist


