


Crude Oil Technical Forecast: WTI Near-term Trade Levels
- Crude Oil updated technical trade levels & sentiment – Daily & 120min Charts
- WTI ranges below long-term downtrend resistance– risk for further losses while below 42.34
- New to Oil Trading? Get started with this Free How to Trade Oil-Beginners Guide
Crude oil prices plummeted more than 14% into the start of September trade with WTI continuing to hold within the monthly opening-range. Prices are coiling and the near-term recovery remains vulnerable while below multi-year trend resistance. These are the updated targets and invalidation levels that matter on the oil price weekly chart. Review my latest Weekly Strategy Webinar for an in-depth breakdown of this crude oil price setup and more.
Crude Oil Price Chart – WTI Daily

Chart Prepared by Michael Boutros, Technical Strategist; Crude Oil (WTI) on Tradingview
Technical Outlook: Crude oil turned just ahead of long-term downtrend resistance into the start of September with the WTI decline covering nearly three-months in just over a week. I’m not thrilled with the daily chart here but the immediate focus is on a break of a well-defined monthly opening-range for guidance with the risk remaining for a larger correction while below slope resistance.
Daily resistance is eyed at the 2017/2018 lows at 42.05/34 and is backed closely by the objective September open at 42.80- we’ll reserve this threshold as our broader bearish invalidation level with a breach / close above the September range highs needed to validate a larger trend reversal in crude oil prices. Support rests at the mid-June close low / September opening-range low at 36.11/12with a break /c lose below exposing the 100% extension at 33.82.
Crude Oil Price Chart – WTI 120min

Notes: A closer look at crude oil price action shows WTI trading within the confines of a descending pitchfork formation extending off the July / August highs with a rebound off the lower parallel now trading within an embedded ascending channel formation. Initial support rests with the July 2016 low at 39.17 with the near-term bullish invalidation set to the 61.8% Fibonacci retracement of the mid-month rally at 38.15– look for a larger reaction there IF reached. A topside breach above confluence resistance at 42.02/34 would shift the focus back towards the February low/ 100% extension at 43.83/99.

Bottom line: Oil prices continue to trade within the monthly opening-range with the immediate recovery vulnerable into the 42-handle. From a trading standpoint, look for a reaction on a stretch towards the upper parallel for guidance with a break below 38.15 needed to shift the near-term focus lower again in WTI. Review my latest Crude Oil Weekly Price Outlook for a closer look at the longer-term WTI technical trade levels.
For a complete breakdown of Michael’s trading strategy, review his Foundations of Technical Analysis series on Building a Trading Strategy
Crude Oil Trader Sentiment – WTI Price Chart
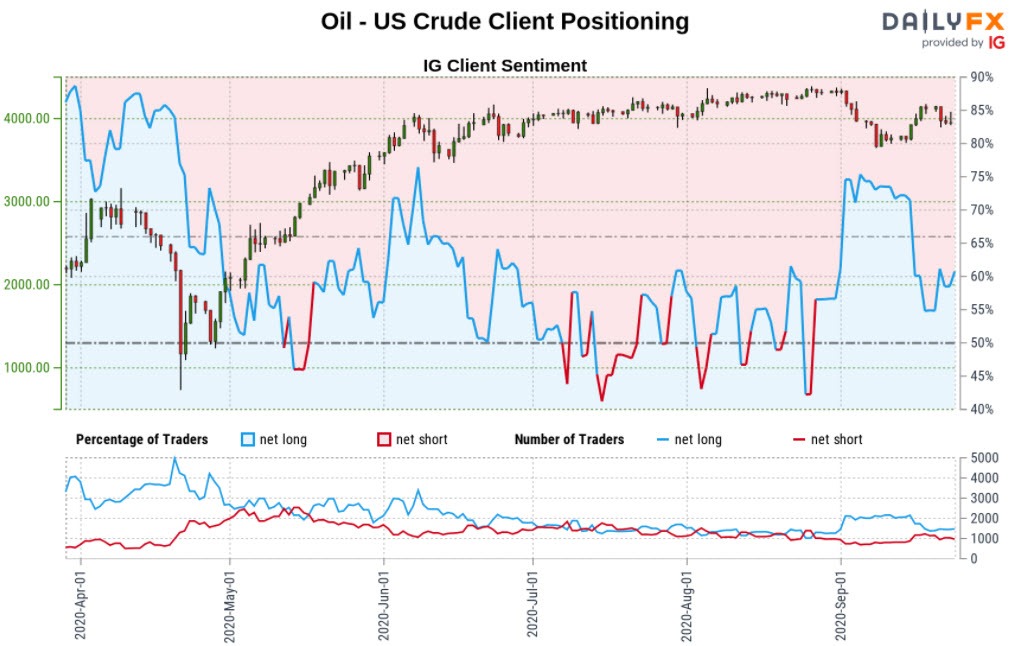
- A summary of IG Client Sentiment shows traders are net-long crude oil - the ratio stands at +1.47 (59.52% of traders are long) – weak bearish reading
- Long positions are 2.38% lower than yesterday and 13.14% lower from last week
- Short positions are4.59% lower than yesterday and 12.07% lower from last week
- We typically take a contrarian view to crowd sentiment, and the fact traders are net-long suggests Oil - US Crude prices may continue to fall. Traders are more net-long than yesterday but less net-long from last week. The combination of current positioning and recent changes gives us a further mixed Oil - US Crude trading bias from a sentiment standpoint.
| Change in | Longs | Shorts | OI |
| Daily | 3% | -7% | 1% |
| Weekly | 31% | -38% | 7% |
---
Active Technical Setups
- S&P 500 Technical Outlook: Bears Challenge First Major Support
- Canadian Dollar Outlook: USD/CAD Breakout Levels- Bull’s First Test
- Australian Dollar Forecast: AUD/USD Plummets, Can Bulls Back the Bid?
- Dollar vs Mexican Peso Outlook: USD/MXN Rally Eyes Trend Resistance
- Gold Price Outlook: XAU/USD Rally Stalls– Relief or Reversal?

--- Written by Michael Boutros, Technical Strategist with DailyFX
Follow Michael on Twitter @MBForex


