


S&P 500 Index Technical Price Outlook: SPX500 Near-term Trade Levels
- S&P 500 Index updated technical trade levels & sentiment – Daily & 120min Charts
- SPX500 beaks uptrend support – sell-off testing key infection zone at yearly open
- What is S&P 500? A Guide to the S&P 500 Index
The S&P 500 Index plummeted more than 10% from the monthly high with the sell-off now testing the first major zone of support around the 2020 yearly open. The immediate focus is on a reaction / inflection off this threshold with a break lower risking a larger correction in the index. These are the updated targets and invalidation levels that matter on the SPX500 technical price charts. Review my latest Weekly Strategy Webinar for an in-depth breakdown of this S&P 500 setup and more.
S&P 500 Price Chart – SPX500 Daily
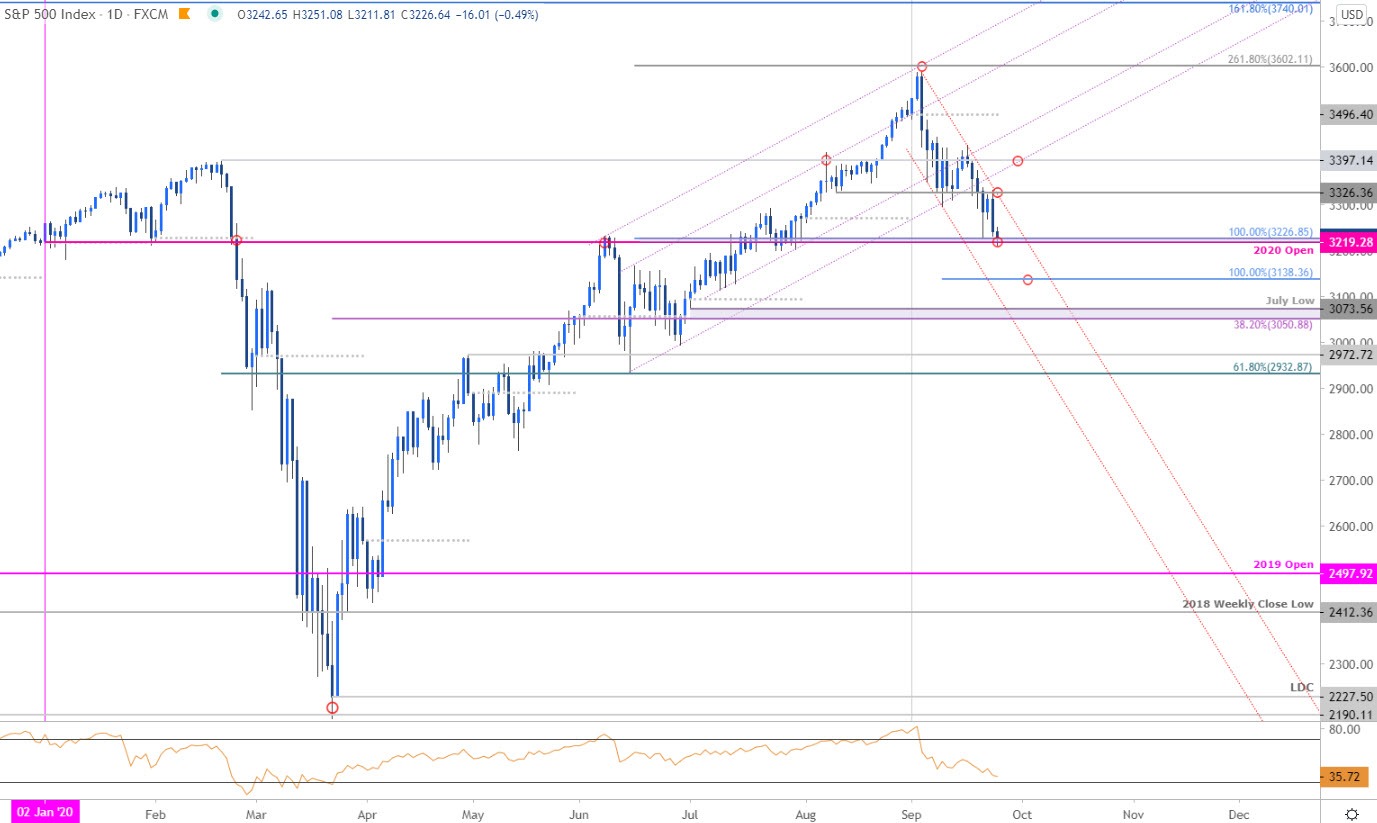
Chart Prepared by Michael Boutros, Technical Strategist; S&P 500 Index on Tradingview
Technical Outlook: The S&P 500 turned from record highs just ahead of confluence resistance into the start of September trade at 3602 with the index breaking below uptrend channel support last week. The decline is now testing the first major technical support confluence at 3219/26- a region defined by the 100% ext of the June advance and the objective 2020 yearly open.
Look for a reaction down here with resistance eyed at the upper parallel backed by 3326. Ultimately, a breach / close above the February highs at 3397 is needed to mark resumption of the broader uptrend. A break lower from here would risk a larger price correction with such a scenario exposing subsequent objectives at the 100 % extension of the monthly decline at 3138 backed by critical support at the 38.2% Fibonacci retracement / July low at 3050/73.
S&P 500 Price Chart – SPX500 120min
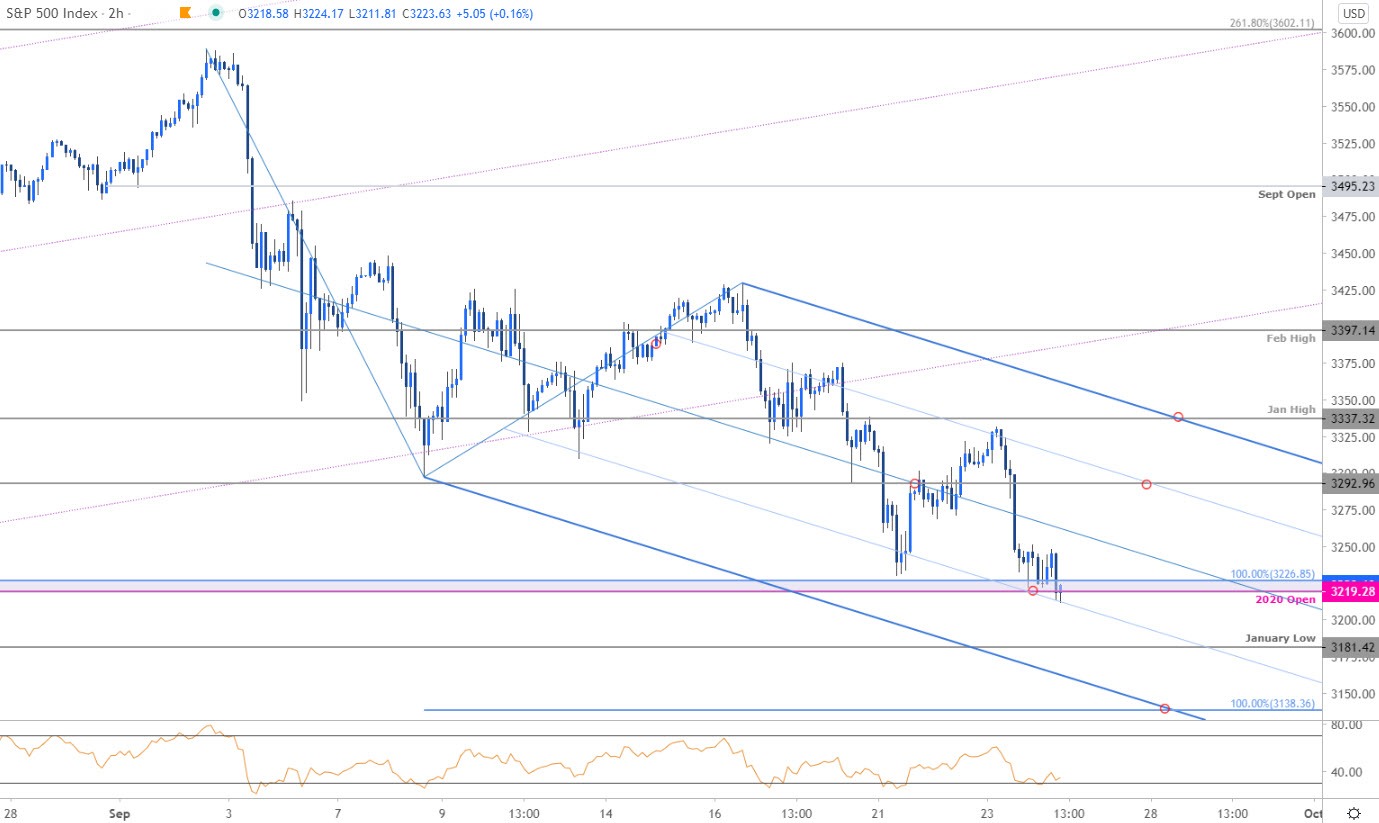
Notes: A closer look at S&P 500 price action shows the index continuing to trade within the confines of a modified descending pitchfork formation extending off the record highs. Note that the 25% parallel rests just below confluence support at 3216/26 and further highlights the technical significance of this region. Initial resistance stands at the median-line backed by 3292 and the upper parallel / January high at ~3337. We’ll reserve this threshold as our bearish invalidation level with a break lower from here keeping the focus on the January lows at 3181 and the lower parallel / 100% ext at 3138- look for a larger reaction there IF reached (area of interest for possible downside exhaustion).

Bottom line: The S&P 500 breakdown is testing the first major zone of support and we’re looking for a reaction. From at trading standpoint, a good area to reduce short-exposure / lower protective stops. Be on the lookout for possible topside exhaustion ahead of 3337 on recoveries with a break / close below 3219 needed to suggest a larger correction is underway towards 3138.
For a complete breakdown of Michael’s trading strategy, review his Foundations of Technical Analysis series on Building a Trading Strategy
S&P 500 Trader Sentiment – SPX500 Price Chart

- A summary of IG Client Sentiment shows traders are net-short the index - the ratio stands at -1.14 (46.76% of traders are long) – neutralreading
- Long positions are6.41% higher than yesterday and 7.45% higher from last week
- Short positions are 10.00% lower than yesterday and 4.55% lower from last week
- We typically take a contrarian view to crowd sentiment, and the fact traders are net-short suggests US 500 prices may continue to rise. Yet traders are less net-short than yesterday and compared with last week. Recent changes in sentiment warn that the current SPX500 price trend may soon reverse lower despite the fact traders remain net-short
| Change in | Longs | Shorts | OI |
| Daily | 1% | -1% | 0% |
| Weekly | 15% | -13% | -1% |
---
Key US Data Releases

Economic Calendar - latest economic developments and upcoming event risk.
Active Technical Setups
- Canadian Dollar Outlook: USD/CAD Breakout Levels- Bull’s First Test
- Australian Dollar Forecast: AUD/USD Plummets, Can Bulls Back the Bid?
- Dollar vs Mexican Peso Outlook: USD/MXN Rally Eyes Trend Resistance
- Gold Price Outlook: XAU/USD Rally Stalls– Relief or Reversal?
- Sterling Technical Outlook: Cable Crush After Key Resistance Test?
- Written by Michael Boutros, Currency Strategist with DailyFX
Follow Michael on Twitter @MBForex


