
The S&P 500 is a major stock market index that tracks the performance of the largest companies listed on US exchanges such as the New York Stock Exchange (NYSE) and Nasdaq. In this piece, we explore what the S&P 500 represents, its history, how it’s calculated, and how to go about trading it.
What is the S&P 500?
The S&P 500 is an index that, as of 2019, comprises 505 common stocks listed by 500 large-cap companies on the US stock market. Its constituents make up approximately 80% of the entire market capitalization of American equities, according to S&P Global.
The S&P 500 chart is updated daily and is a popular live indicator for the strength of the US equity market. It can be found under a variety of other names, including the Standard & Poor’s 500 and US 500, and the ticker SPX.
Contrary to popular belief, the index does not include all of the top 500 companies in terms of market capitalization. This is because eligibility for the S&P index is determined by a number of criteria – not just market cap – as outlined below.
What are the S&P 500 companies and who is eligible?
The S&P 500 lists 500 large-cap companies from the US, including household names such as Apple, Alphabet (Google), Microsoft, Amazon and Facebook. Its composition is not fixed, however, as listing is dependent on strict criteria.
S&P 500 Eligibility is based on a company’s:
- Market capitalization
- Domicile (country of origin, which must be US)
- Exchange listing
- Organizational structure
- Share type and liquidity
- Float (the proportion of shares available to the public)
- Date of IPO
Eligibility is reviewed periodically by committee and the index is updated whenever necessary – an event normally announced with a few days’ notice.
How is the S&P 500 calculated?
The S&P 500 index is calculated by ‘market capitalization weighting’, meaning each company within the index is given a weighting according to the total value of its outstanding shares. The index therefore takes into account both the number and value of the shares that are available for public trading.
Companies with a large number of expensive shares have bigger weightings than companies with a small number of cheap shares. Changes to the S&P 500 price are calculated in real time, so that as the prices of the individual companies fluctuate, the S&P live chart will adjust too.
History of the S&P 500
The history of the S&P 500 in its current form begins on March 4, 1957, but its origins can be traced back to 1923 when it was introduced as the Composite Index and only consisted of a small number of US stocks.
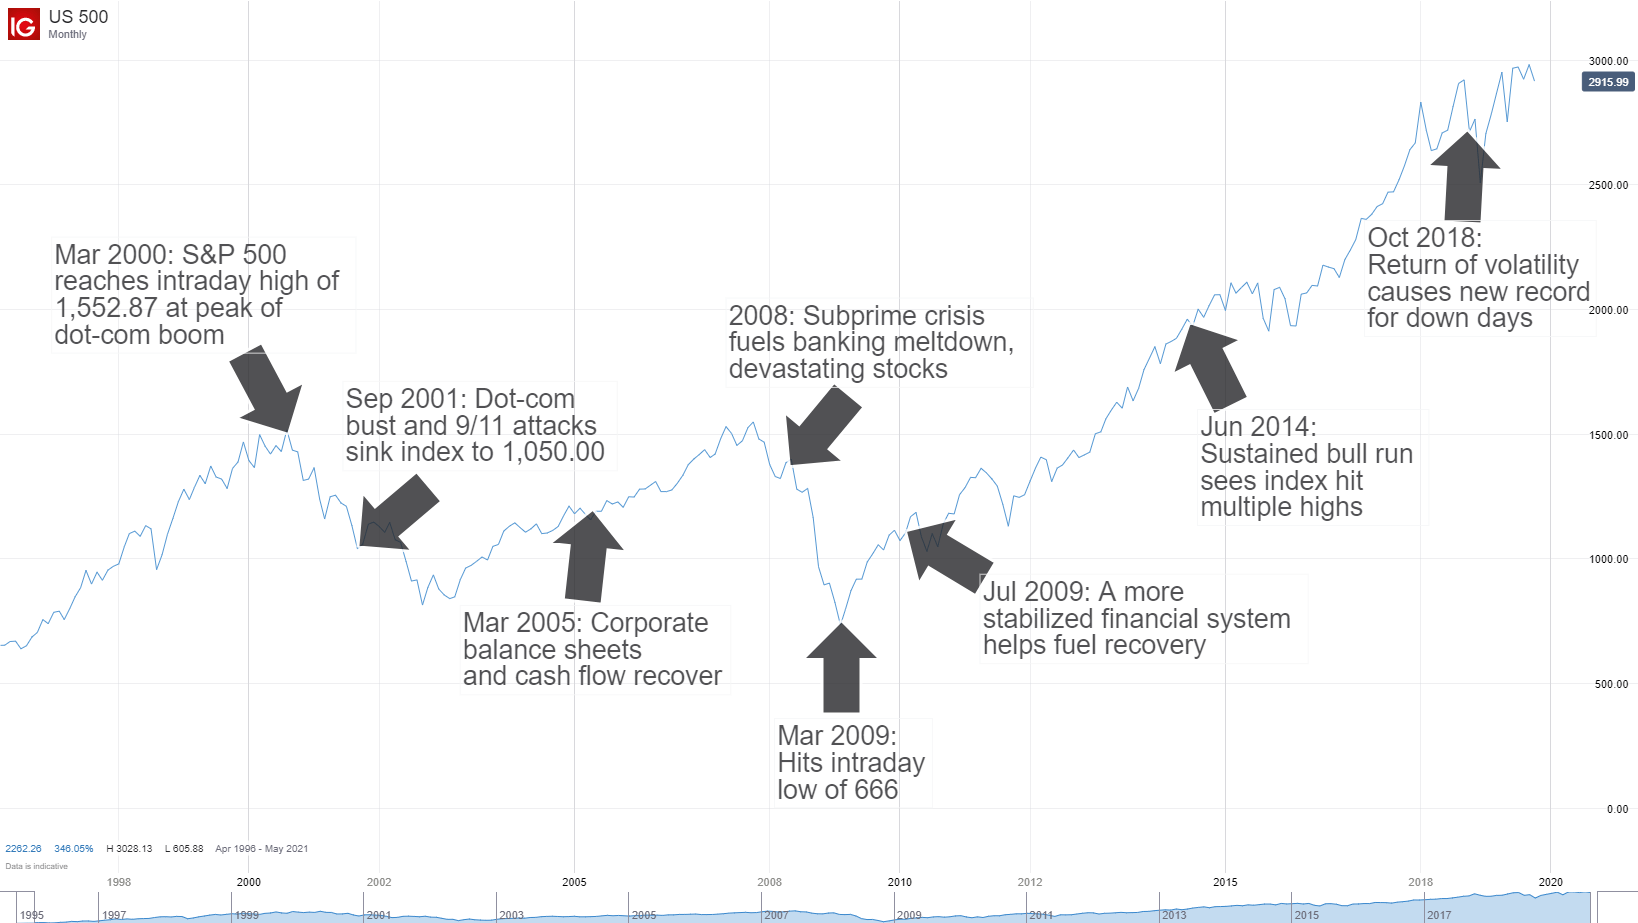
Since 1957, the S&P index has seen annualized returns averaging over 11% – though this does not take into account inflation, which would see that figure revised downwards. However, while the average annual return has been positive, there has been significant volatility between years. For example, the index fell by about 60% during the 2008-2009 financial crisis, while in 2013 it rose by over 32% as the global economy began to recover.
The below chart shows some key landmarks in the price of the S&P 500 this century and the reasons for the swings.
What Affects the Value of the S&P 500?
The S&P 500 price is dependent on the value of the companies that make up the index. Among other factors, their values can be affected by the following:
- Central Bank Policies: The monetary policies set by the Federal Reserve (Fed) affect the cost of borrowing and, in turn, spending and investment by businesses and consumers.
- Economic Performance: In times of growth and high employment, many stocks will rise due to increased spending across the economy.
- Currency Valuations: A strong US Dollar makes it cheaper for companies to buy imports, while a weak Dollar will make their exports more competitive internationally.
- Commodity Prices: Major commodities are the basic building blocks of the global economy, so it is not surprising that the value of many stocks can be heavily influenced by their cost.
- The value of the S&P 500 can also be affected by financial crises, natural disasters, elections and government policies, which makes it important for traders to keep up to date with breaking news.
How to trade S&P 500
The S&P 500 can be traded through S&P futures and options, and exchange-traded funds (ETFs). Also, where permitted CFDs and spread betting are possibilities for those seeking to speculate on the index’s upward or downward price movements. DailyFX also offers more technical advice on how to trade S&P 500, looking at strategies, expert tips and trading hours.
Reasons to trade S&P 500
- Proxy to the US economy: The S&P 500 features companies from many different sectors and is therefore often seen as a proxy for trading the strength of the US economy as a whole.
- Volatility: The S&P 500 price can move rapidly in response to interest rate decisions and macroeconomic releases, including US non-farm payrolls figures. This volatility creates opportunities for traders to profit – either by going long if they think the index will rise in value, or short if they think its price will fall. Read more on stock market volatility.
- Liquidity: The S&P is a liquid market, meaning it generally sees high trading volume. Consequently, traders will usually find there are enough buyers and sellers in the market to be able to enter and exit positions at the price they want. Read more on the benefits of stock market liquidity.
Further reading on the S&P 500
Start your S&P 500 trading journey with our S&P 500 news and analysis from our expert analysts. See how the S&P 500 live price has moved over time and why, and make sure you download our free equities forecast by scrolling down to the ‘Forecasts’ section, for more on how to trade this market more consistently.