


To receive Tyler’s analysis directly via email, please SIGN UP HERE
Talking Points:
- Crude Oil Technical Strategy: Velocity Is Fading, Bullishness Is Not
- July Expiration May Provide Volatility, Watching June Opening Range Breakout
- Sentimental Trading System Shows Upside Signal Remains Strong
WTI Crude Oil Price came within a whisper of the 2016 high on Tuesday after hitting $50.10 in mid-morning trading ahead of July Contract expiration. Regardless of recent force, the CL1 June contract has seen a May price range of ~14% (43.03-50.21) that may be slowing down but does not appear done.
After being the laughing stock of markets, Oil Bulls are looking at the longest run of gains in five years as they look to add another month to the streak of consecutive gains. While little is expected of the OPEC meeting this week, with some calling it a non-event, there is plenty to be on the watch for this week including the European Central Bank as well as the May Non-Farm Payroll release on Friday morning.
Additionally, escalations in Libya continue to hold Oil trader’s attention. However, larger risk-sentiment as seen via the SPX500 so far has continued to favor the view that the stock of supply as seen in the weekly API & EIA inventory data that is pushed back one day this week due to US Holiday’s on Monday will continue to show a draw due to increased demand.
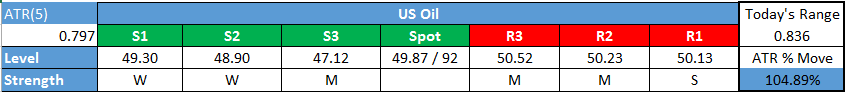
While looking at the Average True Range, you can see that the price of Oil has become less volatile. Implied Volatility in Crude Oil ended last week at its lowest levels since August, which may show that Bears do not see a reason to fight the four-month uptrend that could continue. Also, the highest traded options contract on Friday as per Bloomberg was December 2017 $60 calls that also show long-term bullishness.
LT Chart Shows Price Continues To Move Above Resistance / Prior Price Ceilings Denoting Strength

Key Support & Resistance Levels from Here (Visual Map Below)
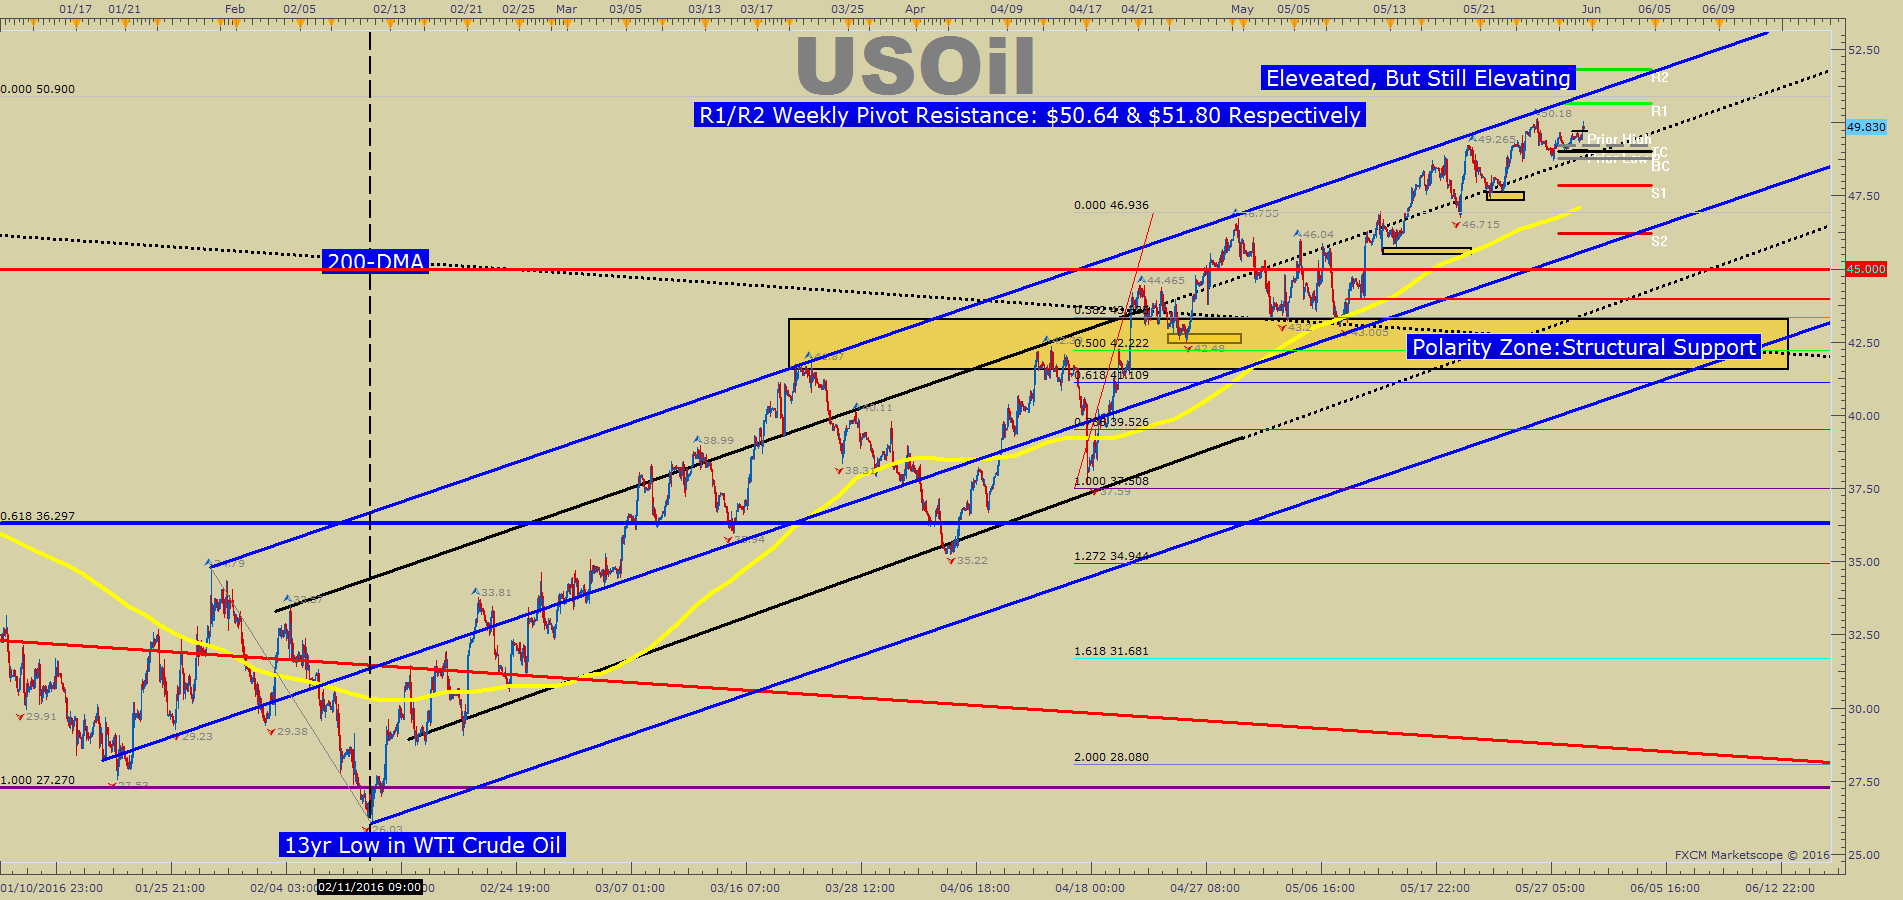
Looking at the chart above, since bouncing off the $43 level to piercing $50/bbl on Thursday morning, the market appears determined to buy dips toward multi-day lows despite the retail crowd’s intentions (shown below).
The recent low worth focusing on appears to be near the Weekly Pivot, which is close to $48.71 and appears to be a good support to favor staying long or at least, not to pay attention to getting short until it breaks.
Below $48.71 is the late April high of ~$46.755/bbl that also aligns with the 21-DMA. A break below would not only take out two key levels of support.
Current resistance is the confluence of the Weekly R2 Pivot, the 100% Fibonacci Expansion taken from the April Opening Range Low, and the October High. This range encompasses $50.90-51.09/bbl. Beyond there, price looks only to be targeting higher, and other hard resistance levels appear arbitrary at best though $53.34 & $60.90 do stand out as levels to watch.
While $50/bbl is a good psychological level that may continue to hold down the price, there is a potential that the risk-on rally in 2016 that has benefited commodities the most could have the price move higher still.
Contrarian System Warns of Further Upside As of 5/31/16
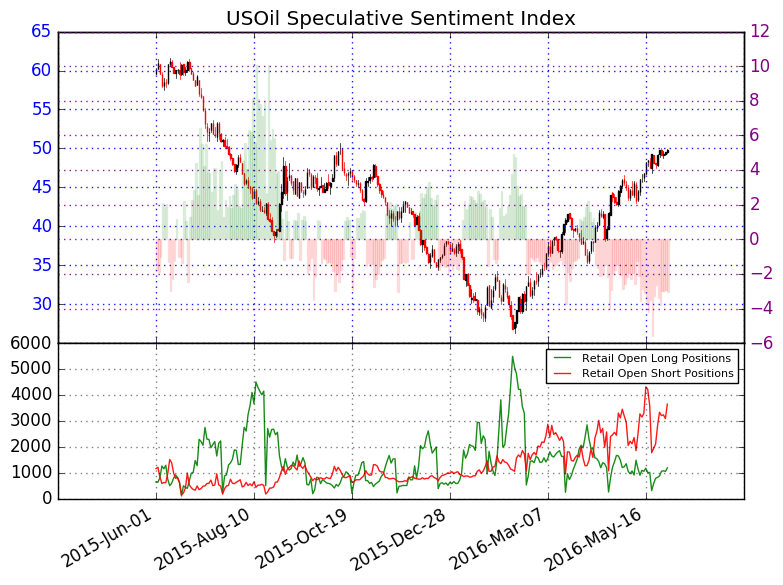
In addition to the technical focus around multiple support-zones, we should keep an eye on retail sentiment, which favors more upside price action. Further upside is currently aligned with our Speculative Sentiment Index or SSI for now.
The ratio of long to short positions in the USOil stands -3.09 as 24% of traders are long. Long positions are 15.3% higher than yesterday and 13.5% below levels seen last week. Short positions are 22.1% higher than yesterday and 49.9% above levels seen last week. Open interest is 20.4% higher than yesterday and 26.8% above its monthly average. We use our SSI as a contrarian indicator to price action, and the fact that the majority of traders are short gives a signal that the USOil may continue higher.The trading crowd has grown further net-short from yesterday and last week. The combination of current sentiment and recent changes gives a further bullish trading bias.
Key Levels Over the Next 48-hrs As of Tuesday, May 31, 2016
T.Y.


