


Canadian Dollar Technical Price Outlook: USD/CAD Weekly Trade Levels
- Canadian Dollar updated technical trade levels - Weekly Chart
- USD/CAD rebounds off key technical support confluence at 1.3057
- Resistance now 1.3364 – Break lower exposes 1.2952
The Canadian Dollar snapped an eight-week winning streak against the US Dollar last week with USD/CAD rebounding off technical support into the September open. A relief rally in the greenback may offer a larger recovery here but the broader risk remains weighted to the downside after breaking below multi-year uptrend support last month. These are the updated targets and invalidation levels that matter on the USD/CAD weekly technical price chart. Review my latest Strategy Webinar for an in-depth breakdown of this Loonie technical setup and more.
Canadian Dollar Price Chart – USD/CAD Weekly
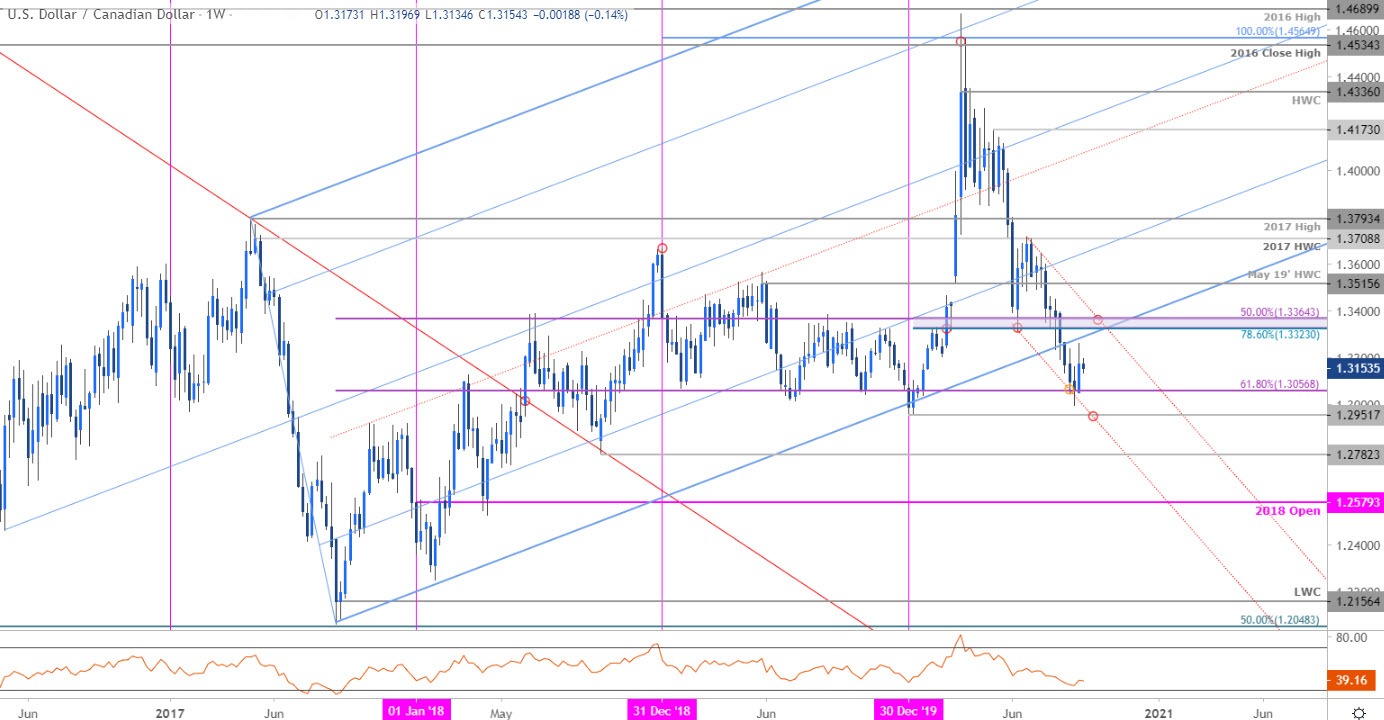
Chart Prepared by Michael Boutros, Technical Strategist; USD/CAD on Tradingview
Notes: In last month’s Canadian Dollar Weekly Price Outlook we noted that a five-week decline had taken USD/CAD into multi-year uptrend support and to be the lookout, “for topside exhaustion ahead of 1.3515 IF price is indeed heading lower.” Loonie continued to its’ advance into the close of August before rebounding off confluence support at with USD/CAD up nearly 1% since the start of September.
The support zone in focus is 1.5057- a level defined by the 61.8% Fibonacci retracement of the entire 2017 advance. Channel support converges on the 2020 yearly opening-range lows at 1.2952 and a break / close below this threshold is needed to fuel the next leg lower in USD/CAD towards 1.2782. Key resistance now stands at 1.3323/64 with a breach / close above the 2019 high-week close at 1.3515 needed to shift the broader focus back to the topside.

Bottom line: USD/CAD responded to key Fibonacci support early in the month and while further topside may be likely near-term, the broader risk remains weighted to the downside while below 1.3364. From a trading standpoint, look for topside exhaustion / swing high while within this channel with a break below the yearly range lows to risk accelerated losses for the Dollar. Review my latest Canadian Dollar Price Outlook for a closer look at the near-term USD/CAD technical trade levels.
For a complete breakdown of Michael’s trading strategy, review his Foundations of Technical Analysis series on Building a Trading Strategy
Canadian Dollar Trader Sentiment – USD/CAD Price Chart

- A summary of IG Client Sentiment shows traders are net-long USD/CAD - the ratio stands at +70.17 (70.17% of traders are long) – bearish reading
- Long positions are2.52% higher than yesterday and 5.88% higher from last week
- Short positions are16.25% higher than yesterday and 8.58% higher from last week
- We typically take a contrarian view to crowd sentiment, and the fact traders are net-long suggests USD/CAD prices may continue to fall. Yet traders are less net-long than yesterday and compared with last week. Recent changes in sentiment warn that the current USD/CAD price trend may soon reverse higher despite the fact traders remain net-long
| Change in | Longs | Shorts | OI |
| Daily | -2% | 7% | 5% |
| Weekly | -30% | 38% | 13% |
---
Key US / Canada Data Releases

Economic Calendar - latest economic developments and upcoming event risk.
Previous Weekly Technical Charts
- Gold (XAU/USD)
- Japanese Yen (USD/JPY)
- New Zealand Dollar (NZD/USD)
- Australian Dollar (AUD/USD)
- British Pound (GBP/USD)
- US Dollar (DXY)
--- Written by Michael Boutros, Technical Currency Strategist with DailyFX
Follow Michael on Twitter @MBForex


