


US Dollar Technical Price Outlook: DXY Weekly Trade Levels
- US Dollar technical trade level update – Daily & Intraday Charts
- USD plummets into trend support at multi-year lows
- DXY bears vulnerable while above 92.28- bearish invalidation steady at95.03
The US Dollar has plummeted more than 8% off the April highs with DXY testing downtrend support at fresh multi-year lows for the second consecutive week. These are the updated technical targets and invalidation levels that matter on the US Dollar Index (DXY) weekly price chart. Review my latest Strategy Webinar for an in-depth breakdown of this Dollar trade setups and more.
US Dollar Index Price Chart – DXY Weekly

Chart Prepared by Michael Boutros, Technical Strategist; US Dollar Index on Tradingview
Notes: In my last US Dollar Weekly Price Outlook we noted that the DXY sell-off was, “poised to complete a sixth weekly decline to fresh yearly lows into confluence support – look for a reaction down here with the shorts vulnerable near-term.” The lows were tested again into the August open with the index set to close flat on the week. The dollar has now failed two attempts to break below support at the lower parallel of the pitchfork formation we’ve been tracking off the 2019 / 2020 highs and the bears remains vulnerable while above this slope near-term.
Initial resistance eyed at the 61.8% Fibonacci retracement / 2016 low-week close at 93.88/92 with broader bearish invalidation steady at the 95.03 confluence zone- ultimately a breach / close above this threshold is needed to invalidate the broader March decline. A break of the lows keeps the focus on the 2018 open at 92.28 and a more critical support confluence at the 2017 low-week close / 78.6% retracement at 91.33- look for a larger reaction in price there IF reached.
For a complete breakdown of Michael’s trading strategy, review his Foundations of Technical Analysis series on Building a Trading Strategy
Bottom line: The US Dollar sell-off is testing slope support at fresh multi-year lows and while the risk remains weighted to the downside, the immediate decline may be vulnerable here. From a trading standpoint, a good zone to reduce short-exposure / lower protective stops – be on the lookout for topside exhaustion ahead of 95.03 IF price is indeed head lower with a break / close below the 92.28 needed to keep the focus lower.

---
Key US Data Releases
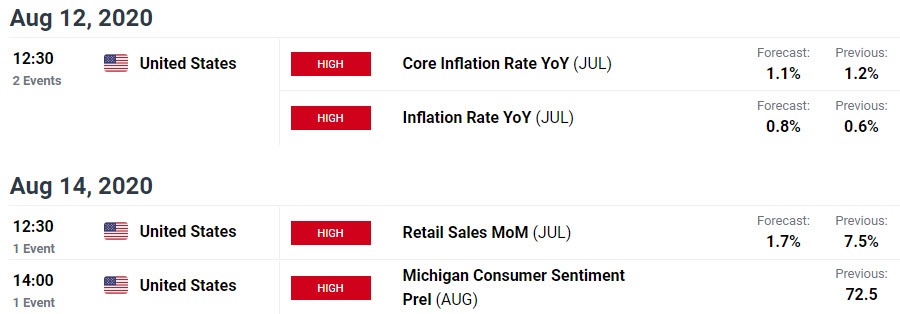
Economic Calendar - latest economic developments and upcoming event risk.
Previous Weekly Technical Charts
- Canadian Dollar (USD/CAD)
- Japanese Yen (USD/JPY)
- Euro (EUR/USD)
- Gold (XAU/USD)
- Australian Dollar (AUD/USD)
- Sterling (GBP/USD)
- New Zealand Dollar (NZD/USD)

--- Written by Michael Boutros, Technical Strategist with DailyFX
Follow Michael on Twitter @MBForex


