


Canadian Dollar Technical Price Outlook: USD/CAD Weekly Trade Levels
- Canadian Dollar updated technical trade levels - Weekly Chart
- USD/CAD rebound off critical uptrend support builds post- NFP
- Resistance now 1.3515 – Break lower exposes key Fibonacci support at 1.3057
The Canadian Dollar rallied 0.25% against the US Dollar this week with USD/CAD attempting a fourth consecutive weekly advance. Price is set to close well off the lows however after rebounding off multi-year confluence support and leaves the broader March sell-off vulnerable in the days ahead. These are the updated targets and invalidation levels that matter on the USD/CAD weekly technical price chart. Review my latest Strategy Webinar for an in-depth breakdown of this Loonie trade setup and more.
Canadian Dollar Price Chart – USD/CAD Weekly
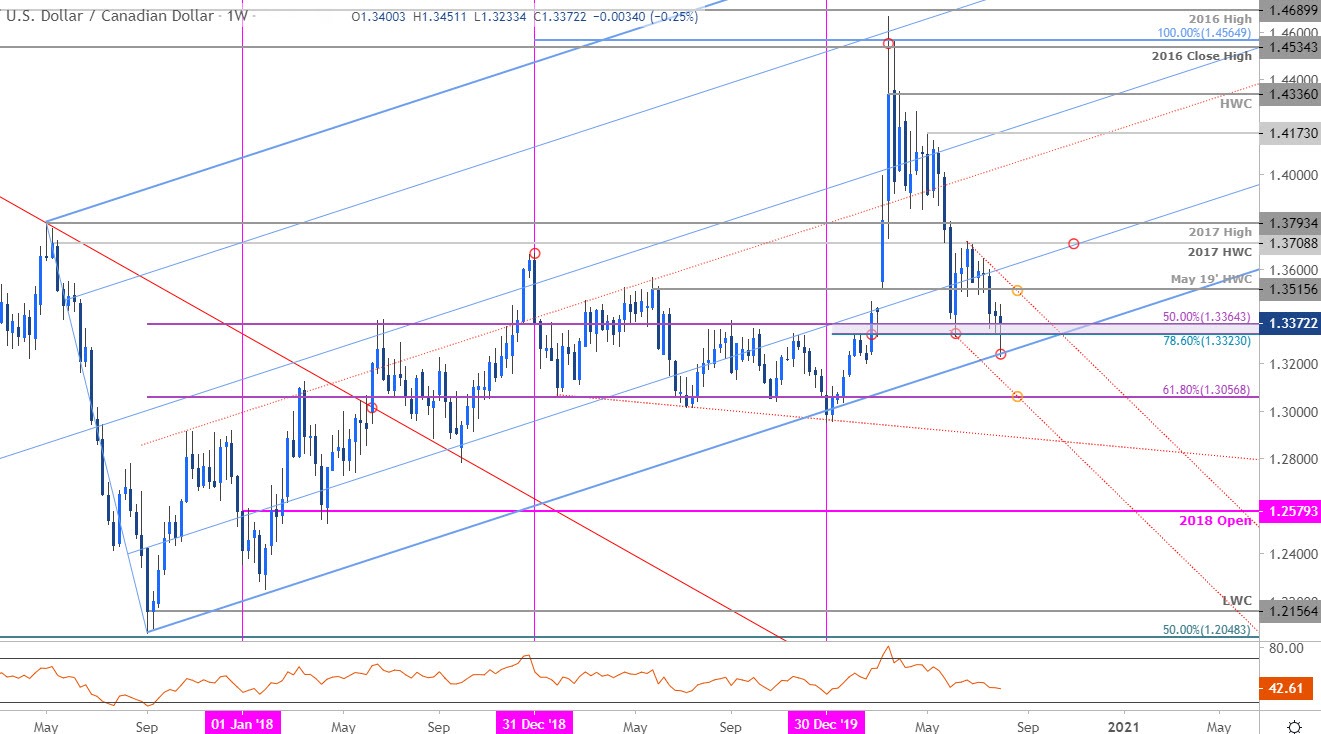
Chart Prepared by Michael Boutros, Technical Strategist; USD/CAD on Tradingview
Notes: In last month’s Canadian Dollar Weekly Price Outlook we noted that it was, “make-or-break for the Loonie bulls here with key, long-term, uptrend support just lower.” The zone in focus was 1.3323/64- a region defined by the 78.6% retracement of the yearly range and the 50% retracement of the 2017 advance. Price briefly probed just below this threshold to register an intraweek low at the 1.3233 – a nearly perfect tag of long-term support at the lower parallel of the pitchfork formation we’ve been tracking off the 2016 / 2017 lows.
A close above 1.3323 / above 40 in weekly RSI - would leave the immediate short-bias vulnerable into the start of next week. Initial resistance now stands at the June trendline / May 2019 high-week close at 1.3515- we’ll now lower our bearish invalidation level to this confluence zone with a breach above the 2017 high-week close at 1.3709 ultimately needed to mark resumption of the broader uptrend. A break / close below this key upslope would keep the focus on the 61.8% Fibonacci retracement at 1.3057- look for a larger reaction there IF reached.

Bottom line: The USD/CAD sell-off is poised to mark a fourth weekly decline into multi-year upslope support at multi-month lows. From at trading standpoint a spot to reduce short exposure / lower protective stops – look for topside exhaustion ahead of 1.3515 IF price is indeed heading lower with a break of this week’s lows needed suggest a larger trend reversal may be underway. Review my latest Canadian Dollar Price Outlook for a closer look at the near-term USD/CAD technical trade levels.
For a complete breakdown of Michael’s trading strategy, review his Foundations of Technical Analysis series on Building a Trading Strategy
Canadian Dollar Trader Sentiment – USD/CAD Price Chart
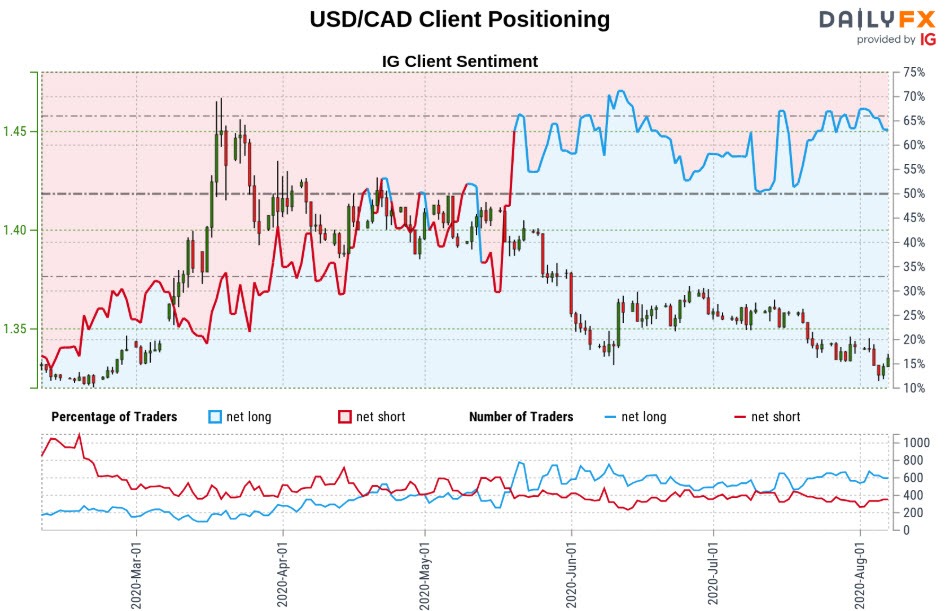
- A summary of IG Client Sentiment shows traders are net-long USD/CAD - the ratio stands at +1.65 (62.21% of traders are long) – bearish reading
- Long positions are8.67% lower than yesterday and 7.77% lower from last week
- Short positions are15.25% lower than yesterday and 10.55% lower from last week
- We typically take a contrarian view to crowd sentiment, and the fact traders are net-long suggests USD/CAD prices may continue to fall. Traders are further net-long than yesterday and last week, and the combination of current sentiment and recent changes gives us a stronger USD/CAD-bearish contrarian trading bias.
| Change in | Longs | Shorts | OI |
| Daily | -2% | 7% | 5% |
| Weekly | -30% | 38% | 13% |
---
Key US / Canada Data Releases

Economic Calendar - latest economic developments and upcoming event risk.
Previous Weekly Technical Charts
- Japanese Yen (USD/JPY)
- Euro (EUR/USD)
- US Dollar (DXY)
- Gold (XAU/USD)
- Australian Dollar (AUD/USD)
- Sterling (GBP/USD)
- New Zealand Dollar (NZD/USD)
--- Written by Michael Boutros, Technical Currency Strategist with DailyFX
Follow Michael on Twitter @MBForex


