


Canadian Dollar Forecast Overview:
- The Canadian Dollar has seemingly been held back in the past week or two, amid concerns that its largest trading partner – the United States – isn’t nearing a return to normal economic activity. 20% of Canadian GDP is derived from economic activities with the US.
- USD/CAD rates have started to turn the corner out of their downtrend, while CAD/JPY rates retain greater relative potential for topside resolution having maintained their sideways range.
- According to the IG Client Sentiment Index, USD/CAD rates could turn higher.

Canadian Dollar Struggles to Take Flight
The Canadian economy appears to be struggling to liftoff after the coronavirus pandemic lockdown, not too dissimilar from what its neighbor to the south is facing. Perhaps the struggles of the United States are the primary factor; after all, with energy markets still elevated, it’s difficult to suggest that its oil prices that are holding back Canadian growth.
Instead, consider the fact that 20% of Canadian GDP is directly tied to economic activities in the United States, with nearly 70% of Canadian exports heading to America. It does not feel like a stretch to suggest that, evidence that the US economy backslid in July, may ultimately be the reason why the Canadian Dollar has slowed its gains relative to its major counterparts over the past few weeks.
While USD/CAD rates capped off their fourth consecutive month of losses in July, CAD/JPY rates broke their three-month winning streak. That CAD-crosses are starting to diverge is a strong signal that the Loonie is stuck in a purgatory, somewhere between liftoff and letdown.
Read more: Canadian Dollar Forecast: Do Breakouts Have Legitimacy? - Key Levels for CAD/JPY & USD/CAD
Bank of Canada in Holding Pattern Through End of Year
Even as Canadian economic data appears to have hit a rut alongside their American counterparts (the July Canada unemployment rate is set to come in higher than the July US unemployment rate, according to a Bloomberg News survey), the Bank of Canada appears to be in no hurry to change policy in the very short-term. With no BOC meeting scheduled until September, it’s of little surprise that market participants are watching the improvement in Canadian economic data as evidence that the BOC will stand pat for the foreseeable future.
Bank of Canada Interest Rate Expectations (August 4, 2020) (Table 1)
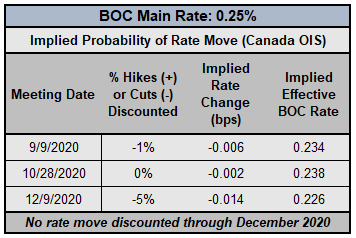
Bank of Canada interest rate expectations have been steady for several months. At the end of April, there was a 55% chance of a 25-bps interest rate cut in December 2020, according to Canada overnight index swaps. By the first week of June, there was less than a 10% chance of a 25-bps rate cut by the end of the year. Now, there is a 5% chance of a 25-bps rate hike through December 2020.
As noted previously, “even if economic conditions continue to improve, that Canada’s largest trading partner, the United States, of which 20% of Canadian GDP is derived, continues to suffer from the coronavirus pandemic will leave the BOC more cautious about normalizing interest rates than they may have been otherwise if the United States managed its COVID-19 outbreak more effectively.”
USD/CAD Rate Technical Analysis: Daily Chart (August 2019 to August 2020) (Chart 1)
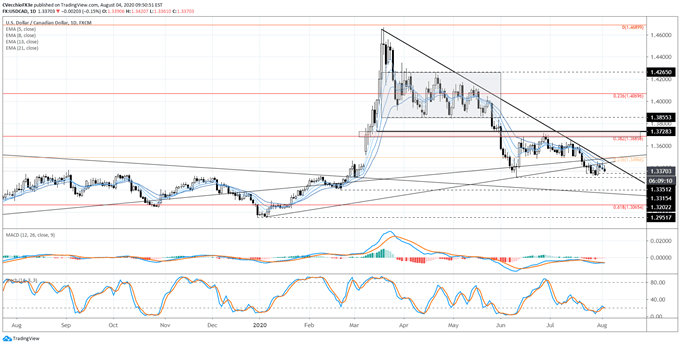
As the downtrend from the March and May swing highs remains intact, we continue to monitor USD/CAD price action around two potential triangles’ support: from the June and July swing lows, which broke on July 21; and from the January and June swing lows, which gave way last week. USD/CAD rates warrant close attention, as price action continues to dance around the rising trendline from the September 2012 and September 2016 lows.
It still holds that several key support levels have proven vulnerable: the 38.2% Fibonacci retracement of the 2016 high/2017 low range at 1.3686 and the 23.6% retracement of the 2012 low/2016 high range at 1.3497 are now critical resistance.
Bearish momentum has eased, but remains the predominant bias. USD/CAD rates are below their daily 5, 8-, 13-, and 21-EMA envelope, which is realigning in bearish sequential order. Daily MACD is trending lower below its signal line again, while Slow Stochastics are turning lower just above oversold territory. While the pair has struggled to continue their decline in recent weeks, it may be the case that a break of the June low at 1.3315 would signal the continuation of a more significant letdown in USD/CAD rates.
USD/CAD Rate Technical Analysis: Weekly Chart (December 2016 to August 2020) (Chart 2)
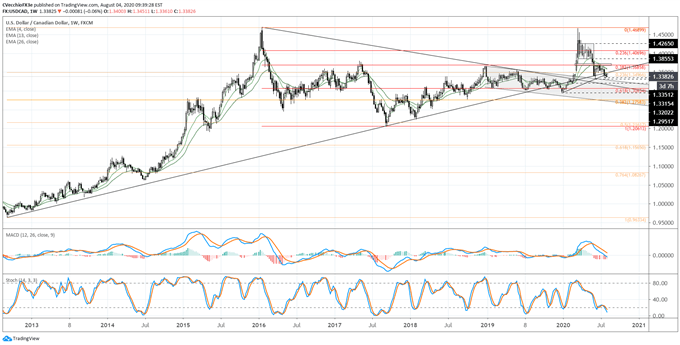
There may no longer be a longer-term upside bias in USD/CAD rates as this narrative is under threat given the potential for the pair to break the rising uptrend from the September 2012 and September 2016 lows. In the event that this trendline does give way over the coming sessions, the longer-term view would shift from a bullish symmetrical triangle to a bearish double top.
IG Client Sentiment Index: USD/CAD Rate Forecast (August 4, 2020) (Chart 3)
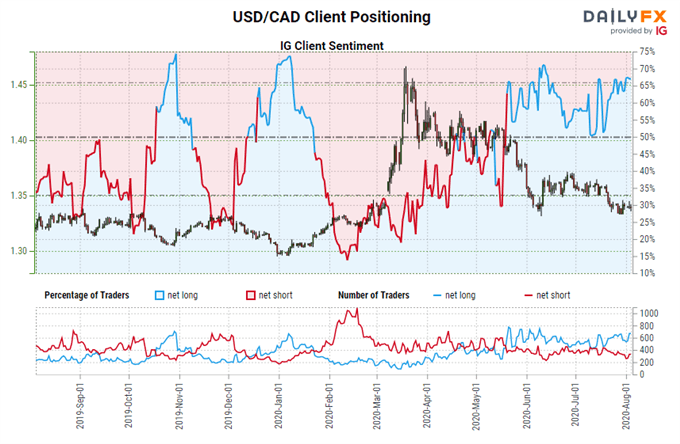
USD/CAD: Retail trader data shows 62.13% of traders are net-long with the ratio of traders long to short at 1.64 to 1. The number of traders net-long is 14.63% lower than yesterday and 7.22% lower from last week, while the number of traders net-short is 29.73% higher than yesterday and 12.61% higher from last week.
We typically take a contrarian view to crowd sentiment, and the fact traders are net-long suggests USD/CAD prices may continue to fall.
Yet traders are less net-long than yesterday and compared with last week. Recent changes in sentiment warn that the current USD/CAD price trend may soon reverse higher despite the fact traders remain net-long.
CAD/JPY Rate Technical Analysis: Daily Chart (August 2019 to August 2020) (Chart 4)
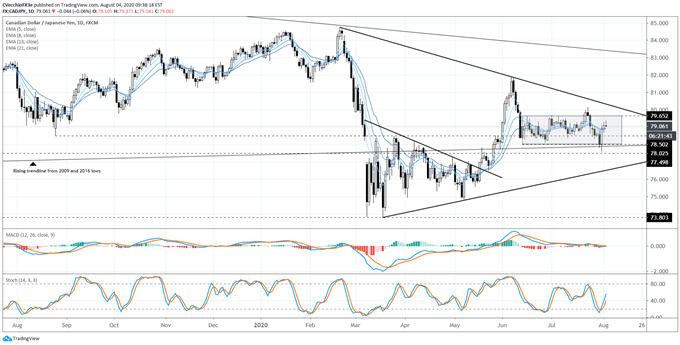
CAD/JPY rates have sustained their climb back above the rising trendline from the 2009 and 2016 lows, helping solidify the perspective that the symmetrical triangle, having formed between early-March and mid-May, was, indeed, a significant bottoming effort. In the short-term, CAD/JPY rates remain in the range for which they’ve now trade for the past three weeks, between 78.03 and 79.65 (false breakouts on both sides).
At present time, CAD/JPY rates are above their daily 5-, 8-, 13-, and 21-EMA envelope, which is aligning in bullish sequential order. Daily MACD is neutral while hovering just above the signal line, while Slow Stochastics have continued to advance through the median line (but not fully). CAD/JPY rates remain on the radar as resolution to recent consolidations is sought.
CAD/JPY Rate Technical Analysis: Weekly Chart (June 2007 to August 2020) (Chart 5)
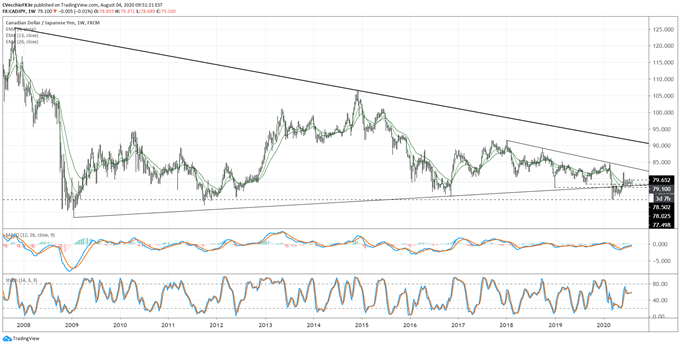
Bigger picture for CAD/JPY rates: while there is much ground to be made up to get back to the 2020 highs established in late-February, breaking out above 78.50 has seen CAD/JPY rates rise above the descending trendline from the October 2018 and July 2019 lows, offering another piece of evidence that a near-term low – if not the long-term bottom – may have been established.

Read more: Euro Forecast: Resistance Holds, For Now - Key Levels for EUR/JPY & EUR/USD
--- Written by Christopher Vecchio, CFA, Senior Currency Strategist


