


Euro Forecast Overview:
- EUR/USD rates gained more than +4% in July for the first time since March 2016, and July 2020 put in its best performance since September 2010.
- While EUR/USD rates continue to hover below resistance, EUR/JPY rates are starting to probe through its recent swing highs.
- Per the IG Client Sentiment Index, the Euro has a mixed if not bearish bias.

Euro Rally Hits Brakes…
The Euro, the best performing major currency since mid-May, just capped off its best monthly performance since September 2010. EUR/USD rates posted gains north of +4% for the first time since March 2016, while EUR/JPY rates gained the most since June 2017. But the past few days, particularly around the end of the month, have seen the Euro rally slow, if not hit the brakes. The forex economic calendar over the coming days may help reinforce the prevailing trend in recent weeks.
…Will Data Reinforce or Buck Narrative?
As is typical during the first week of a new month, the forex economic calendar is saturated with significant event risk. While the Euro does not have a central bank meeting on its agenda over the coming days (unlike the Australian Dollar or the British Pound), incoming PMI data should continue to point to a recovery gathering pace in the Eurozone.
In the world of FX, everything is about relativity; and while the UK PMI figures are likely to outpace those in the Eurozone (perhaps helping explain the recent pullback in EUR/GBP rates; the UK economy is growing relatively faster than the EU), the Eurozone PMIs are set to continue to outpace those coming from the United States.
EUR/USD RATE TECHNICAL ANALYSIS: WEEKLY CHART (November 2016 to August 2020) (CHART 1)
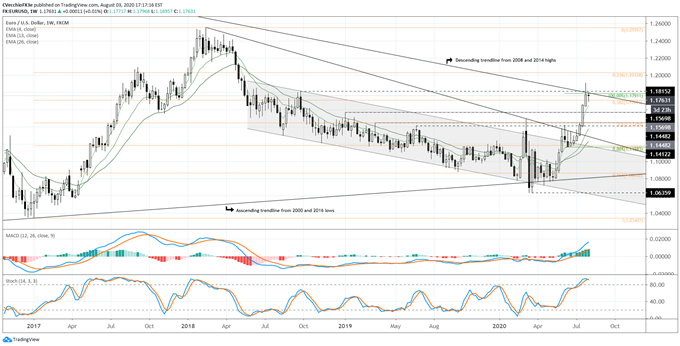
EUR/USD rates have hit significant near-term resistance, a zone that holds several important levels that could ultimately dictate a pause in the recent run higher. The 38.2% retracement of the 2017 low/2018 high range comes in at 1.1709 (as indicated by the orange Fibs in Charts 1 & 2). Taking the move from the European Recovery Fund announcement date in May, to the June high and to the June low (within the symmetrical triangle), and the 100% Fibonacci extension (as indicated by the green Fibs in Charts 1 & 2) comes in at 1.1791.
Furthermore, the descending trendline from the 2008 and 2014 highs is nearby at 1.1800. A breakout through this zone (roughly 1.1709 to 1.1800) would be a significant long-term bullish development for EUR/USD rates. EUR/USD rates are above their weekly 4-, 13, and 26-EMA envelope, while weekly MACD is pushing higher and Slow Stochastics are lingering in overbought territory.
EUR/USD RATE TECHNICAL ANALYSIS: DAILY CHART (August 2019 to August 2020) (CHART 2)
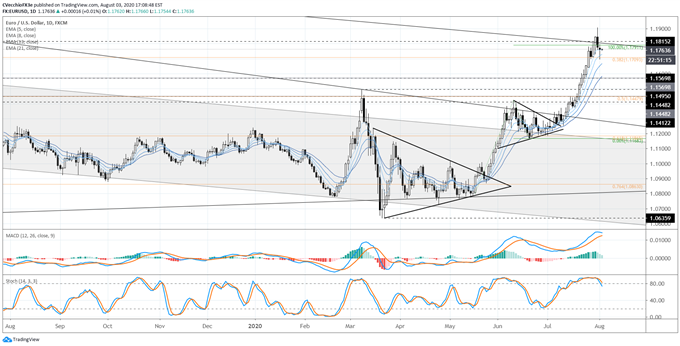
It is worth noting that EUR/USD rates are holding below resistance in the form of the long-term trend from all-time highs, trapped between the 100% Fibonacci extension (1.1791) and the 38.2% Fibonacci retracement (1.1709). It still holds that this is a successful breakout from the multi-year downtrend originating at the February 2018 highs.
At present time, EUR/USD rates are holding above their daily 5-, 8-, 13-, and 21-EMA envelope (which is still in bullish sequential order). Daily MACD, while cooling off, is still in bullish territory, and Slow Stochastics are starting to pullback from overbought territory – but without a subsequent pullback in price. Bullish momentum has been firm, and a pause does not mean that the uptrend is finished.
IG Client Sentiment Index: EUR/USD Rate Forecast (August 3, 2020) (Chart 3)
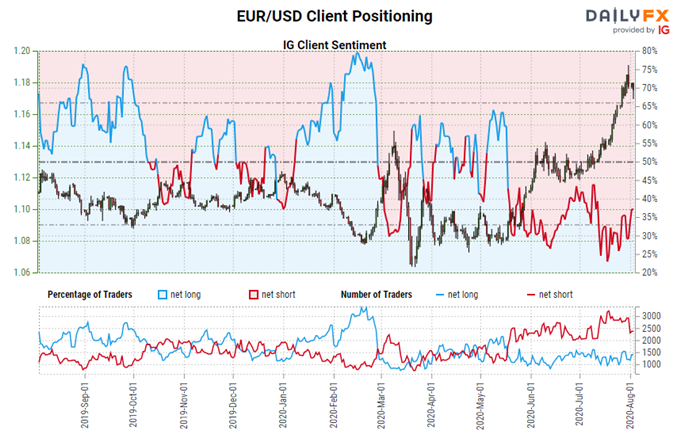
EUR/USD: Retail trader data shows 33.01% of traders are net-long with the ratio of traders short to long at 2.03 to 1. The number of traders net-long is 0.72% lower than yesterday and 3.67% higher from last week, while the number of traders net-short is 16.11% higher than yesterday and 0.04% lower from last week.
We typically take a contrarian view to crowd sentiment, and the fact traders are net-short suggests EUR/USD prices may continue to rise.
Positioning is more net-short than yesterday but less net-short from last week. The combination of current sentiment and recent changes gives us a further mixed EUR/USD trading bias.
EUR/JPY RATE TECHNICAL ANALYSIS: DAILY CHART (August 2019 to August 2020) (CHART 4)
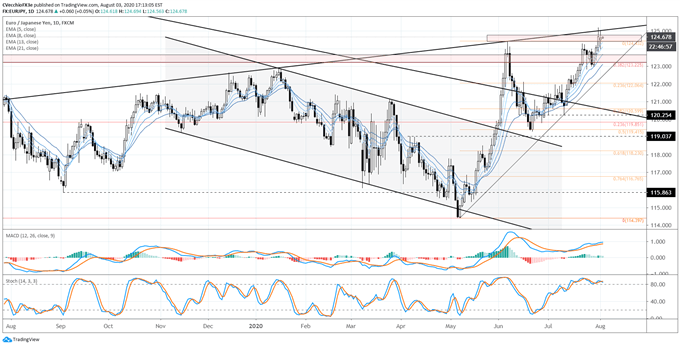
EUR/JPY rates have proven stronger than EUR/USD rates in recent days, thanks in part to the snapback in USD/JPY rates higher. The EUR/JPY rally has carried price back through a significant area of interest in recent years, between 123.65 and 123.88, an area that proved to cap price action during the EUR/JPY rally in late-May/early-June. Now, EUR/JPY rates are finding resistance around the June swing high, and the uptrend from September 2012, September 2016, and January 2019 swing lows.
EUR/JPY rates have risen above their daily 5-, 8-, 13-, and 21-EMAs, which remains in bullish sequential order. Daily MACD’s rise in bullish territory has resumed, while Slow Stochastics are holding in overbought territory. A double top may no longer be forming in EUR/JPY rates; a break above 125.50 would constitute a significant bullish development.
IG Client Sentiment Index: EUR/JPY Rate Forecast (August 3, 2020) (Chart 5)
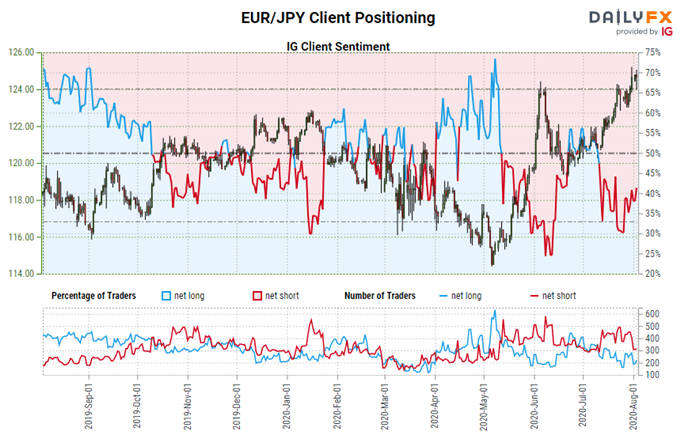
EUR/JPY: Retail trader data shows 45.77% of traders are net-long with the ratio of traders short to long at 1.18 to 1. The number of traders net-long is 27.51% higher than yesterday and 15.42% higher from last week, while the number of traders net-short is 8.46% higher than yesterday and 23.11% lower from last week.
We typically take a contrarian view to crowd sentiment, and the fact traders are net-short suggests EUR/JPY prices may continue to rise.
Yet traders are less net-short than yesterday and compared with last week. Recent changes in sentiment warn that the current EUR/JPY price trend may soon reverse lower despite the fact traders remain net-short.
Read more: USD/MXN Rates Turn Higher - Does Bearish Breakout Potential Persist?
--- Written by Christopher Vecchio, CFA, Senior Currency Strategist


