Mexican Peso Forecast Overview:
- USD/MXN rates have warded off a potential significant breakdown, and now are turning higher back to key resistance – and former triangle support.
- Both USD/CAD and USD/MXN rates have started to turn higher, and the forex economic calendar this week caters to heightened volatility.
- We can use the IG Client Sentiment Index for USD/CAD rates as a close proxy for USD/MXN exposure.


Mexican Peso Struggling to Continue Multi-Month Trend
The Mexican Peso had a weaker end to July than USD/MXN bears had hoped for, and the start of August does not look like it is off to a promising start for the Peso. As the pair grinds higher alongside a stronger DXY Index, USD/MXN rates find themselves at the precipice of reversing a multi-month downtrend in place since the depths of the coronavirus pandemic’ impact on financial markets in March.
It’s not just USD/MXN rates that soon may see the recent trend of Peso strength reversed: another safe haven-linked cross, MXN/JPY rates, appear to be in trouble too (per Strategist Paul Robinson’s latest research note). Reversals in both USD/MXN and MXN/JPY rates could see multi-month trends reversed in a significant manner as August gets under way.
Mexican Peso Forex Economic Calendar Week Ahead
The beginning of a new month brings about the typical smattering of important data releases on the forex economic calendar. The week started off on a poor foot with the July Mexican Business Confidence index coming in barely above 38. Mexican data are sparse over the week until Friday, when the July inflation report is due. Otherwise, focus will be mainly on its North American counterparts, which have a steady flow of ‘medium’ and ‘high’ rated data releases over the course of the week. The crescendo arrives on Friday, alongside the Mexican CPI report, when both the July Canada and US jobs reports are due.
USD/MXN Rates No Longer Heading South?
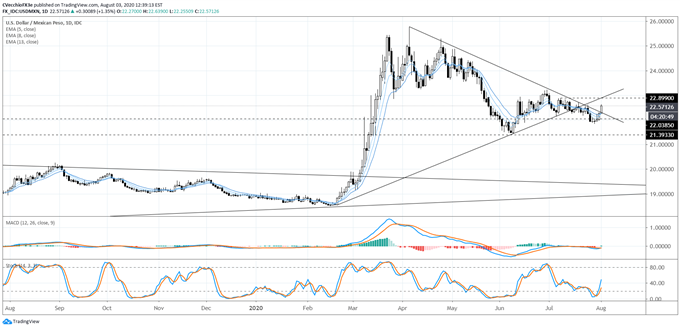
From one perspective, there may have been (and may still be) an argument to be made that USD/MXN rates had been consolidating in a symmetrical triangle between February and early-July. In context of the prevailing direction, the triangle was looking for a bullish resolution. In late-July, price action in USD/MXN rates were, as we noted at the time, “discouragingly weak, with no follow-through to the topside at a critical moment: just as price action moved into the terminal vertex of the triangle.”
USD/MXN Rate Technical Analysis: Daily Chart (August 2019 to August 2020) (Chart 1)

Failure outside of the triangle, kickstarting a bearish breakout attempt as triangle support gave way while resistance held firm. We’ve previously suggested that “the bearish outside engulfing bar on the daily chart [on July 24] to end the week, occurring as a failed attempt to retake triangle support, is a bearish omen for USD/MXN rates.”
But there was no follow-through to the downside, and finding support near the 2018 high around 22.0385, USD/MXN rates have sprung to the topside, breaking triangle resistance as constituted by the downtrend from two critical April and July daily hammer candles: the yearly high and the aforementioned bearish outside engulfing bar, respectively.
Bullish momentum is starting to accelerate, with USD/MXN rates above their daily 5-, 8-, 13-, and 21-EMA, which is turning towards bullish sequential order. Daily MACD is turning higher just below its signal line, while Slow Stochastics have started to quickly accelerate towards their median line. Now, USD/MXN rates appear to be on their way back to what was support in the triangle, now resistance; coupled with the July high, USD/MXN rates appear to be aiming for 22.8900 in the short-term.
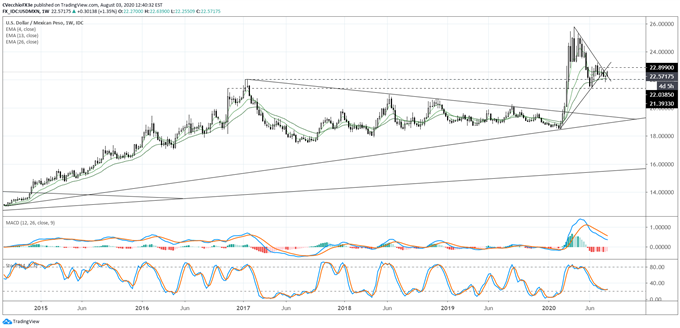
USD/MXN Rate Technical Analysis: Weekly Chart (August 2019 to August 2020) (Chart 2)

The prospective triangle failure warrants a review of longer-term timeframes. The 2017 high comes in at 22.0385, coinciding neatly with the weekly 26-EMA, equivalent to a six month moving average. While this level held as support, failure below this area would bring into focus the June lows once more at 21.459. For now, focus is upon a return to 22.8900.
Using a Proxy to Track USD/MXN Retail Positioning
With respect to the difference in performance between USD/CAD and USD/MXN rates in recent weeks, it should be noted that the Canadian economy is more independent from the US economy than is the Mexican economy. While the United States is both countries’ largest trading partner, over 80% of Mexico’s exports go to the United States (compared to near 70% for Canada), while 30% of Mexico’s GDP is derived from economic activities involving the United States (compared to 20% for Canada).
The close proximity of both countries given their trade relationship with the United States also means that their currencies tend to trade in a similar fashion as well. In other words, there is a reasonable basis of expectation for USD/CAD and USD/MXN rates to trade in a similar fashion. To this end, the 20-day correlation between USD/CAD and USD/MXN rates is currently 0.74; one week ago, the 20-day correlation was 0.66.
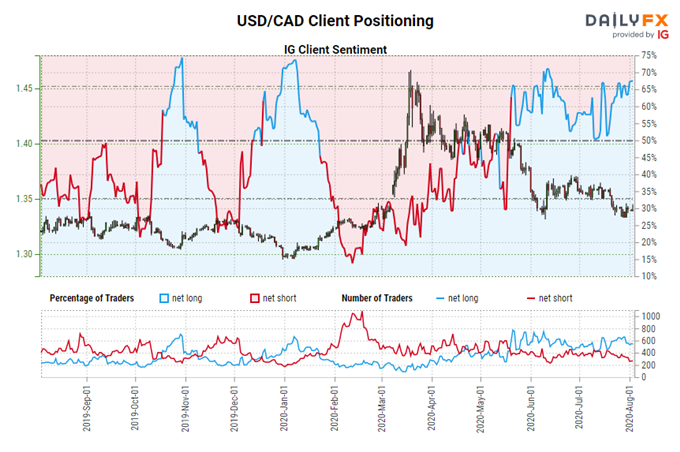
IG CLIENT SENTIMENT INDEX: USD/CAD RATE FORECAST (AUGUST 3, 2020) (CHART 3)

USD/CAD: Retail trader data shows 69.35% of traders are net-long with the ratio of traders long to short at 2.26 to 1. The number of traders net-long is 21.48% higher than yesterday and 0.58% lower from last week, while the number of traders net-short is 15.53% higher than yesterday and 22.78% lower from last week.
We typically take a contrarian view to crowd sentiment, and the fact traders are net-long suggests USD/CAD prices may continue to fall.
Traders are further net-long than yesterday and last week, and the combination of current sentiment and recent changes gives us a stronger USD/CAD-bearish contrarian trading bias.


Read more: Weekly US Dollar Technical Forecast: All Hands on Deck
--- Written by Christopher Vecchio, CFA, Senior Currency Strategist


