


CANADIAN DOLLAR FORECAST: USD/CAD PRICE PRIMED FOR VOLATILITY AS EMPLOYMENT DATA RELEASE & OPEC MEETING LOOM
- USD/CAD tests a major technical support level around the 1.40 handle after sliding more than 4% from its recent swing high
- The Canadian Dollar has rebounded ahead of an OPEC meeting and expected crude oil production cuts
- Spot USD/CAD price action looks to high impact jobs data on deck for release and set to reveal the rise in unemployment due to COVID-19
USD/CAD has edged lower by about 650-pips, or 4.4%, since March 18 when the US Dollar surged to a fresh four-year high against the Canadian Dollar. One fundamental development that likely alleviated upward pressure on spot USD/CAD price action was an FX swap line extended by the FOMC to the Bank of Canada that offered access to US Dollar liquidity.

Much-needed stabilization in the price of crude oil, on the back of a rumored OPEC meeting slated for April 09, might have helped steer the recent decline in USD/CAD as well. This is considering the CAD to oil correlation.
USD/CAD & CRUDE OIL PRICE CHART: 4-HOUR TIME FRAME (31 JANUARY TO 08 APRIL 2020)
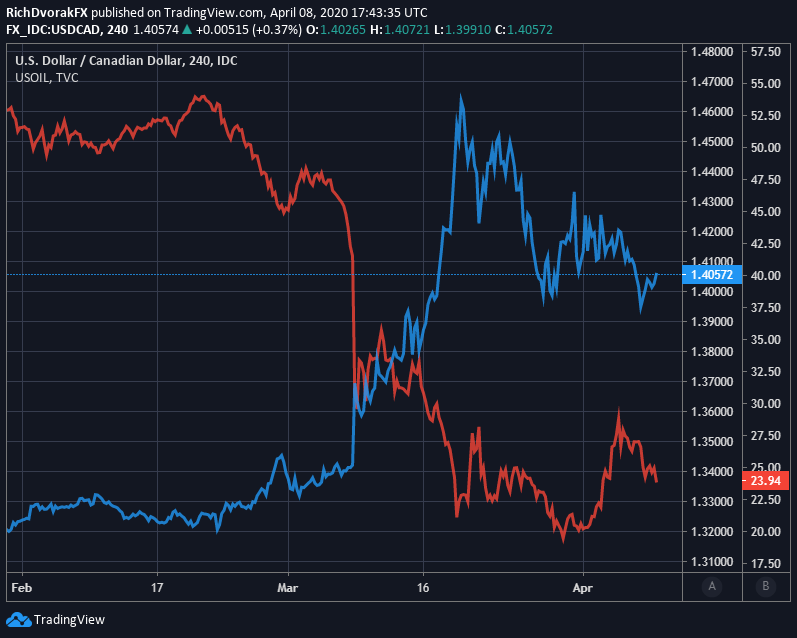
Chart created by @RichDvorakFX with TradingView
The rebound in crude oil off its lowest level in nearly two decades could be short-lived, however, and potentially be headed for a drop below $20, if OPEC and its allies fail to agree on cutting crude oil output. Also, in light of economic damage caused by the coronavirus pandemic, and likely unavoidable recession, oil faces the downside risk that that OPEC+ production cuts will fall short of restoring market supply and demand.

On that note, the International Energy Agency (IEA) recently announced how the crude oil supply glut could continue to bulge, even if OPEC+ cuts production by 10-million barrels per day, with demand and global GDP growth in freefall. Correspondingly, the Canadian economy, which is heavily dependent on energy exports and oil prices, may remain under pressure. This has potential to keep the Canadian Dollar bogged down and spot USD/CAD price action supported.
USD/CAD PRICE CHART: DAILY TIME FRAME (01 JANUARY TO 08 APRIL 2020)
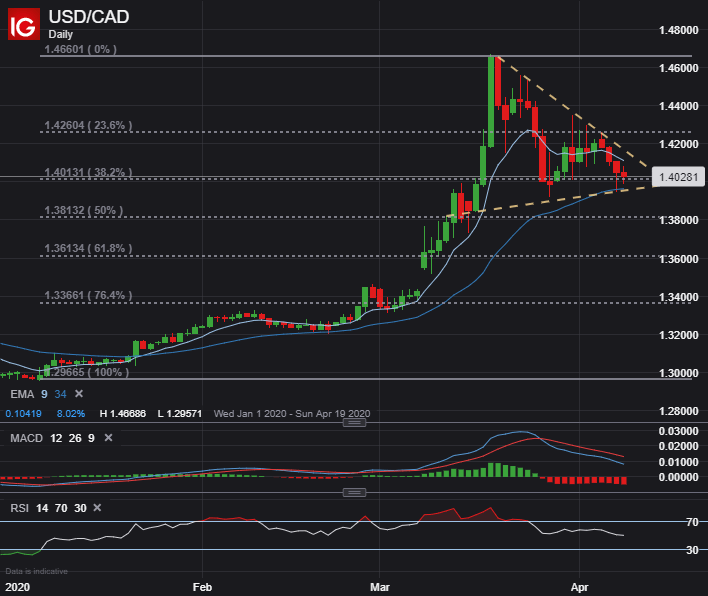
Although, the recent wave of coronavirus optimism, if sustained, might continue to weigh negatively on USD/CAD and the broader US Dollar. Spot USD/CAD price action has meanwhile coiled into a tight triangle pattern as traders wait for these fundamental factors to unfold. On balance, and despite falling more than 4% from its March 18 peak, USD/CAD remains higher by 8% year-to-date.
| Change in | Longs | Shorts | OI |
| Daily | -2% | 7% | 5% |
| Weekly | -30% | 38% | 13% |
After compressing between its short-term 9-day exponential moving average and medium-term 34-day exponential moving average, spot USD/CAD now tests a major level of confluence around the 1.4000 price. This area of technical support is underpinned by the 38.2% Fibonacci retracement of the latest bullish leg printed by USD/CAD.
USD/CAD PRICE CHART: 2-HOUR TIME FRAME (27 MARCH TO 08 APRIL 2020)

At the same time, USD/CAD price action seems to have formed a string of higher lows since Tuesday, which suggests a base may be developing. If USD/CAD sinks back below the 1.4000 handle, however, Canadian Dollar bulls could make a push for a retest of the April 07 and March 27 intraday lows. Nevertheless, conclusions out of the OPEC+ teleconference, as well as the market’s net reaction to initial jobless claims and Canadian employment data releases due Thursday at 12:30 GMT, look to serve as the primary catalysts with potential of sparking the next big move ahead in spot USD/CAD.
-- Written by Rich Dvorak, Analyst for DailyFX.com
Connect with @RichDvorakFX on Twitter for real-time market insight


