


US Dollar Outlook:
- The US Dollar (via the DXY Index) jumped to a fresh yearly high after the October US inflation report, spurring speculation the Fed will accelerate stimulus withdrawal.
- A weak US bond auction in the afternoon saw US Treasury yields jump across the curve, increasing interest rate differentials in favor of a stronger US Dollar.
- The IG Client Sentiment Index suggests that USD/JPY has a mixed bias in the near-term.

US Dollar Rebounds, Bull Flag Breaks
Coming into this week, it appeared that the US Dollar (via the DXY Index) was mired in a range after the November Fed meeting and October US NFP report. A decline in Fed hike odds as a relative ceiling appeared to be reached (markets pricing in June 2022) suggested that the greenback might face more difficult trading conditions in the very near-term. Admittedly, this was wrong; nothing changes one’s mind like price action.
With US inflation hitting its highest level since 1990, and an ensuing US bond auction showcasing weak demand, US Treasury yields surged higher, providing the US Dollar a fresh catalyst in the form of interest rate differentials moving favorably.
While the Fed indicated that it will only taper by $15B/month in November and December, speculation is building that an accelerated taper may take place in early-2022, setting the stage for a rate hike sooner than the aforementioned June 2022 expected date.
More Hawkish Fed Now Anticipated
We can measure whether a Fed rate hike is being priced-in using Eurodollar contracts by examining the difference in borrowing costs for commercial banks over a specific time horizon in the future. Chart 2 below showcases the difference in borrowing costs – the spread – for the November 2021 and December 2023 contracts, in order to gauge where interest rates are headed by December 2023.
Eurodollar Futures Contract Spread (NOVEMBER 2021-DECEMBER 2023) [BLUE], US 2s5s10s Butterfly [ORANGE], DXY Index [RED]: Daily Chart (MAY 2021 to NOVEMBER 2021) (Chart 1)
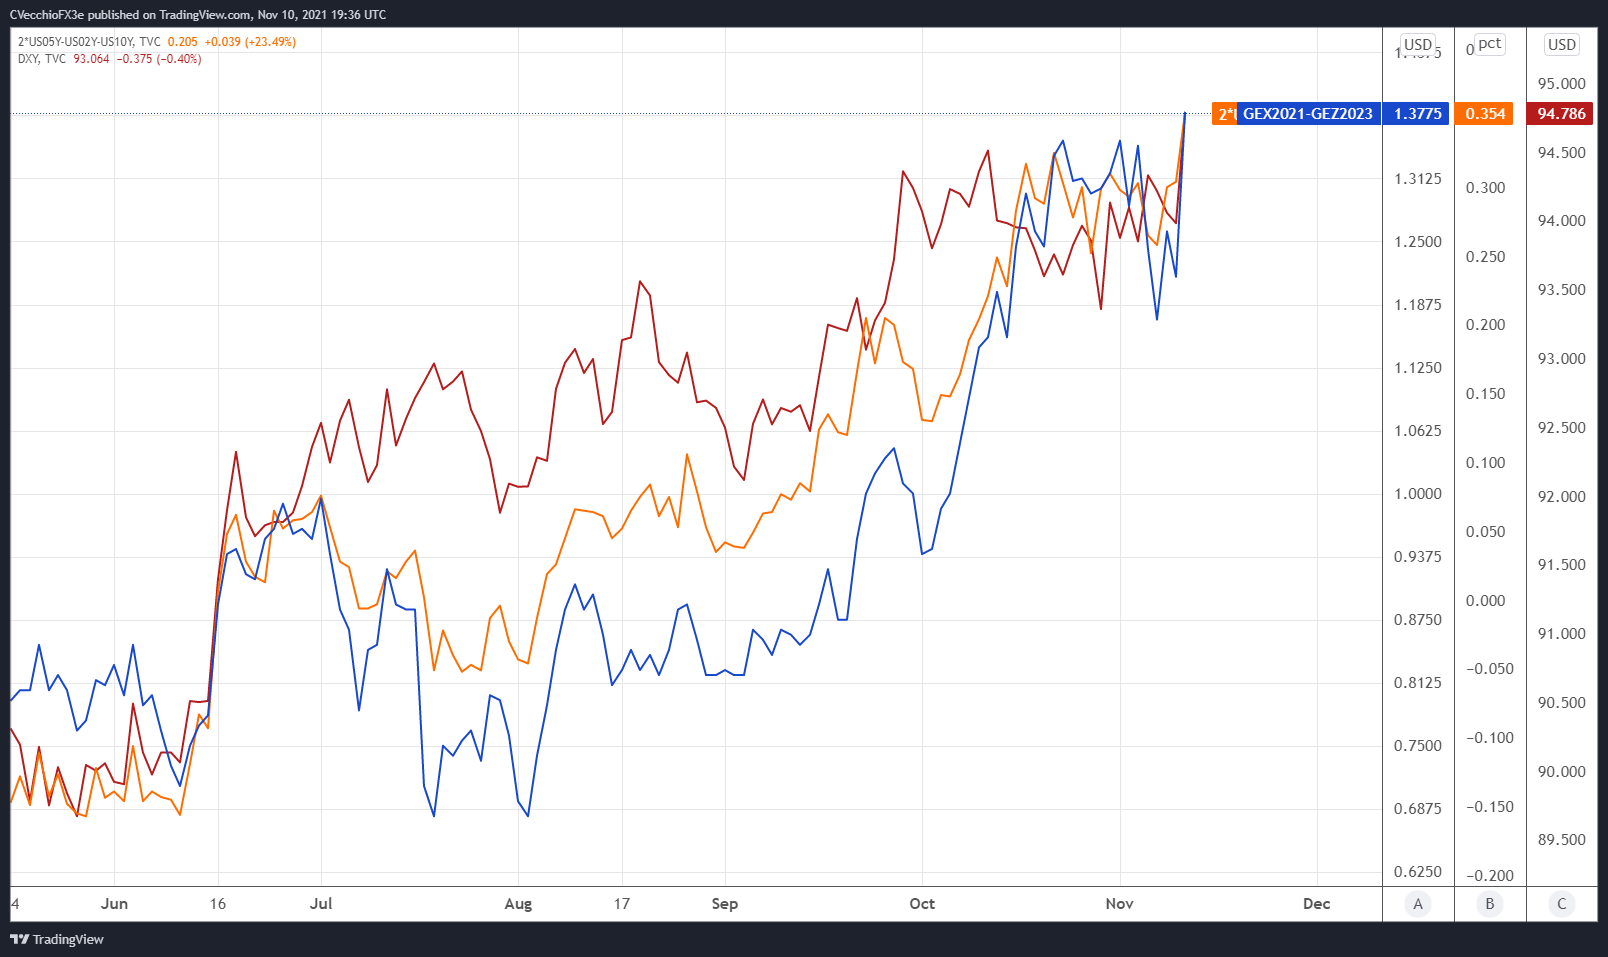
By comparing Fed rate hike odds with the US Treasury 2s5s10s butterfly, we can gauge whether or not the bond market is acting in a manner consistent with what occurred in 2013/2014 when the Fed signaled its intention to taper its QE program. The 2s5s10s butterfly measures non-parallel shifts in the US yield curve, and if history is accurate, this means that intermediate rates should rise faster than short-end or long-end rates.
While last week there were signals that market may have been too aggressive in its pricing about how quickly the Fed will act to raise rates once the taper is complete in the wake of Fed Chair Powell’s press conference and the October US NFP report, the October US inflation report has completely reversed shifts in pricing.
There are 138-bps of rate hikes discounted through the end of 2023 while the 2s5s10s butterfly recently dropped from its widest spread since the Fed taper talk began in June (and its widest spread of all of 2021). This is a significant shift from just last week when there were 117-bps of hikes priced in: there is now a 100% chance of five 25-bps hikes and a 52% chance of six 25-bps hikes.
DXY PRICE INDEX TECHNICAL ANALYSIS: DAILY CHART (SEPTEMBER 2020 to NOVEMBER 2021) (CHART 2)
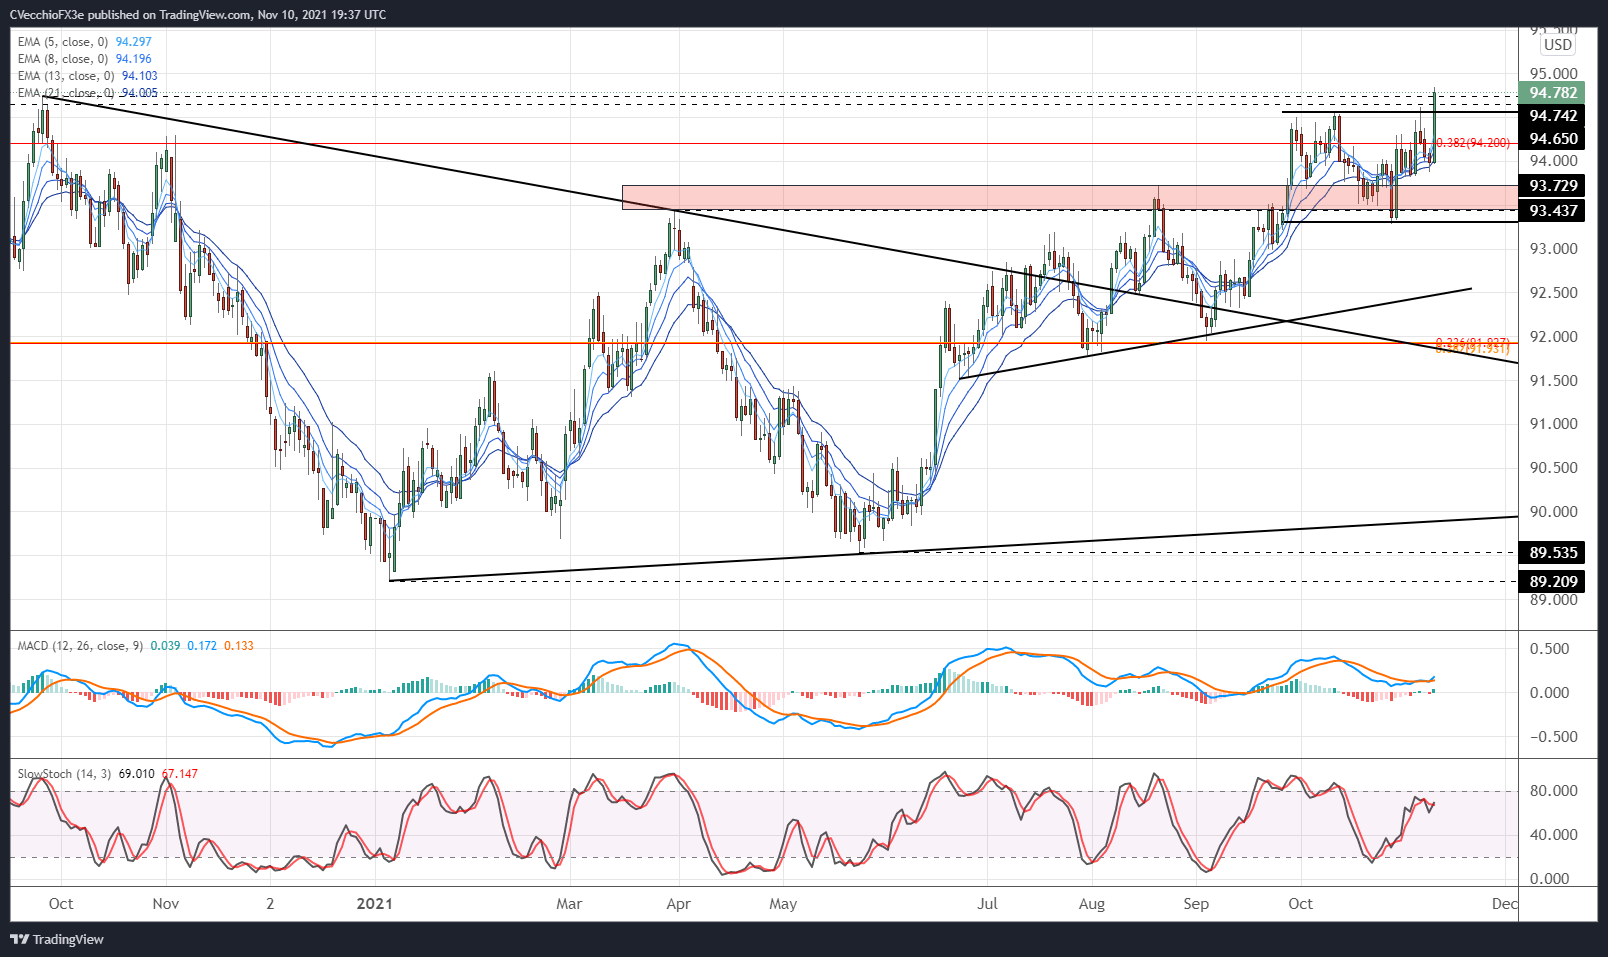
The DXY Index has burst higher on the session, clearing out both its former yearly high set in August as well as the monthly and yearly high established last week after the October US jobs report. In doing so, it also cleared the March 2020 low at 94.65 and the September 2020 high at 94.74. A plethora of resistance has started to break.
Now, bullish momentum is starting to build again. The broad dollar gauge is above its daily 5-, 8-, 13-, and 21-EMA envelope, which is in bullish sequential order. Daily MACD is rising while above its signal line, while daily Slow Stochastics are advancing once more towards overbought territory. Barring a retreat below 94.62, the DXY Index may have just begun its next leg higher in the short-term.

USD/JPY RATE TECHNICAL ANALYSIS: DAILY CHART (January 2021 to November 2021) (CHART 3)

USD/JPY rates appear to be consolidating within a bullish falling wedge, bolstered by the rise in US Treasury yields. As interest rate differentials widen between Treasuries and JGBs, the one-way street is pointing towards more strength in USD/JPY. However, USD/JPY rates may be held back by the fact that US equity markets are experiencing some volatility, which typically goes in hand with Yen strength.
The pair is just starting to reassert itself above its daily EMA envelope, which is in neither bearish nor bullish sequential order. Daily MACD’s decline above its signal line is abating, while daily Slow Stochastics are just exiting oversold territory. While a push to the yearly high at 114.70 can’t be ruled out, advances past here seem unlikely as long as US equity markets are in a state of decline.
IG Client Sentiment Index: USD/JPY RATE Forecast (November 10, 2021) (Chart 4)
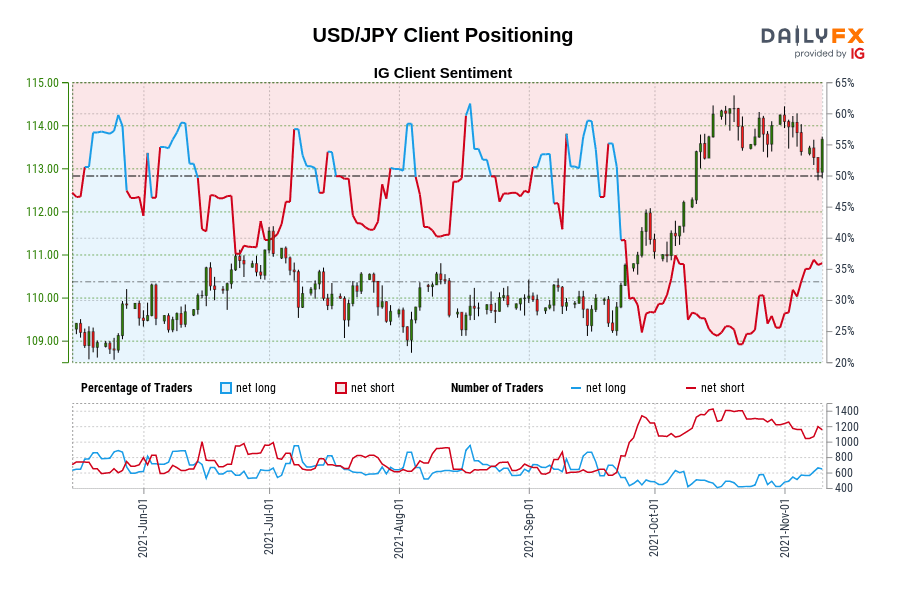
USD/JPY: Retail trader data shows 33.23% of traders are net-long with the ratio of traders short to long at 2.01 to 1. The number of traders net-long is 12.80% lower than yesterday and 1.43% lower from last week, while the number of traders net-short is 3.40% lower than yesterday and 5.46% lower from last week.
We typically take a contrarian view to crowd sentiment, and the fact traders are net-short suggests USD/JPY prices may continue to rise.
Positioning is more net-short than yesterday but less net-short from last week. The combination of current sentiment and recent changes gives us a further mixed USD/JPY trading bias.

--- Written by Christopher Vecchio, CFA, Senior Strategist


