


MKT CALL: MACRO OVERVIEW:
- US stocks’ rally may be reaching a short-term exhaustion point
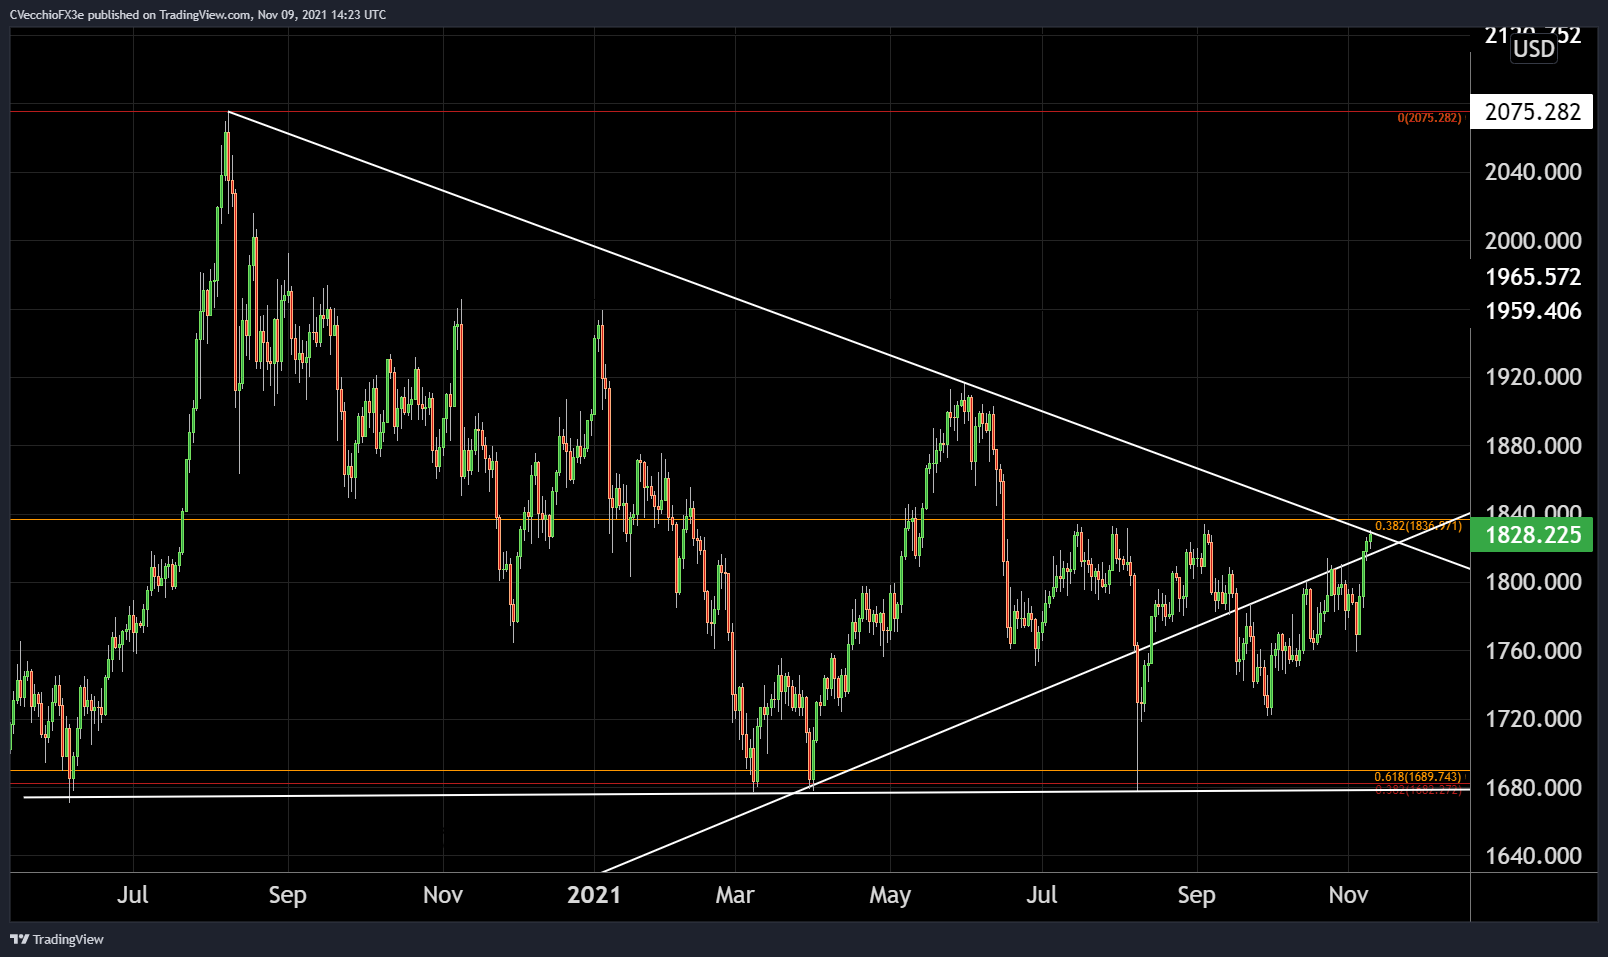
- Falling US real yields are clearing the way for higher gold prices
- Fed rate hike odds may have hit a ceiling, which could prove problematic for the US Dollar
Lower Yields, Lower US Dollar
In this week’s edition of MKT Call: Macro (formerly The Macro Setup), we talked about how the rally by US equities may have reached a short-term exhaustion point, what Elon Musk’s Twitter poll means for Tesla’s stock price, as well as the latest drop lower in US yields – both Treasuries and inflation-adjusted rates.
Recall last week when we discussed that “there is greater than a 60% chance that the Fed hikes begin in June 2022 – it may be the case that the US Dollar is ‘priced to perfection’ – that is, it will be difficult for the Fed to yield a hawkish surprise that could spark a significant greenback rally.”
Indeed, with the Fed indicating that it won’t hike rates prior to the end of QE, which is on track for June 2022, it means that rates markets really can’t get more aggressive from here. If Fed rate hike odds have indeed hit a near-term ceiling, it means that the US Dollar is thus deprived of one of its most potent catalysts over the past few months.
In turn, a US Dollar that trades sideways to lower in the near-term may be good news for commodities (bolstered by a strong growth backdrop), but even beleaguered gold prices, which are now starting to make technical headway towards their summer swing highs.
*For commentary from Dan Nathan, Guy Adami, and myself on the US Dollar (via the DXY Index), the US S&P 500, gold prices, Bitcoin, among others, please watch the video embedded at the top of this article.
CHARTS OF THE WEEK
Eurodollar Futures Contract Spread (NOVEMBER 2021-DECEMBER 2023) [BLUE], US 2s5s10s Butterfly [ORANGE], DXY Index [WHITE]: 4-hour Chart (MAY 2021 to NOVEMBER 2021) (Chart 1)

GOLD PRICE TECHNICAL ANALYSIS: DAILY CHART (MAY 2020 TO NOVEMBER 2021) (CHART 2)
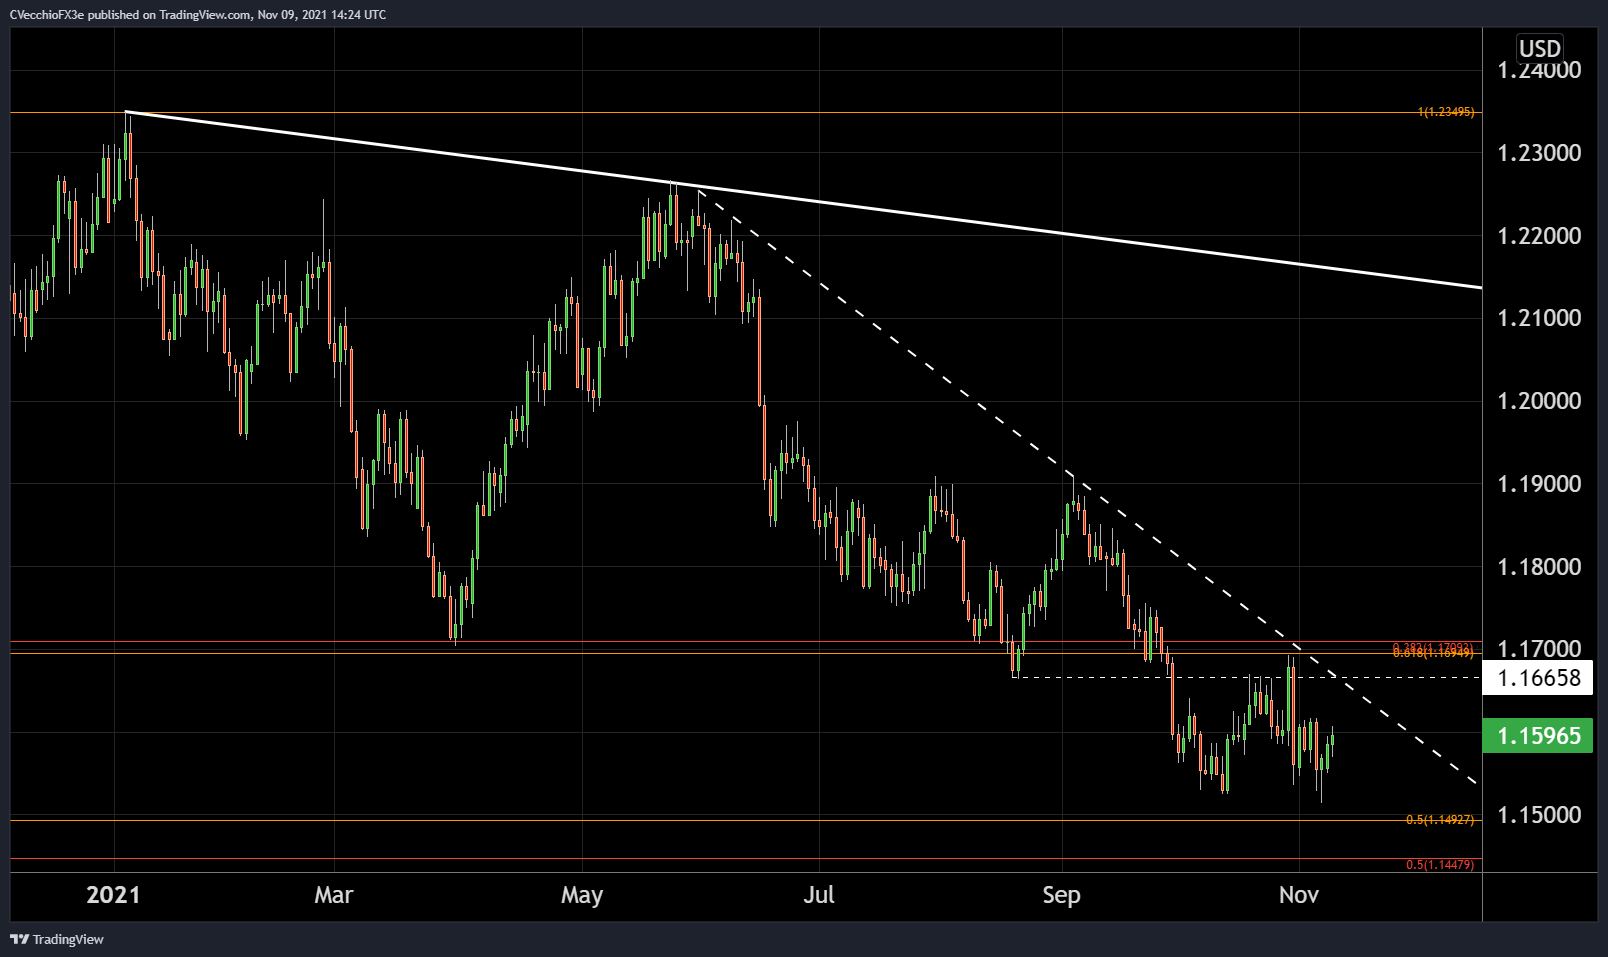
EUR/USD RATE TECHNICAL ANALYSIS: DAILY CHART (MARCH 2021 TO NOVEMBER 2021) (CHART 3)

--- Written by Christopher Vecchio, CFA, Senior Strategist


