


Fundamental Forecast for the US Dollar: Neutral
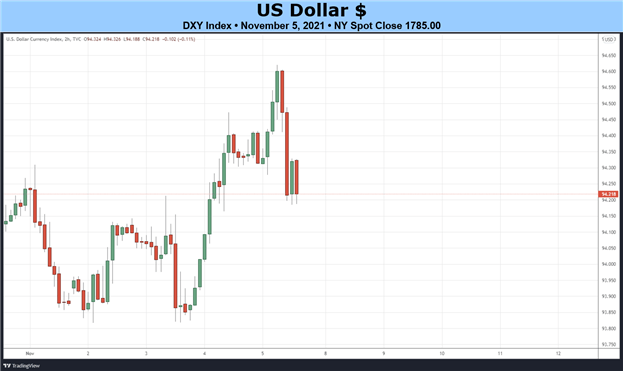
- The US Dollar (via the DXY Index) hit a fresh yearly high by the end of the week, but the outlook moving forward is a bit more complicated than it appears on the surface.
- Rate hike odds may have hit a ceiling, and backing away from that ceiling could drag down the US Dollar.
- According to the IG Client Sentiment Index, the US Dollar has a mixed bias heading into mid-November.

US Dollar Week in Review
The first full week of November saw the US Dollar (via the DXY Index) hit fresh yearly highs in the wake of the November Fed meeting and the October US nonfarm payrolls (NFP) report, only to give back some of the gains by the time trading ended on Friday. EUR/USD rates, the largest component of the DXY Index, actually gained +0.06% over the week. USD/JPY rates dropped by -0.52%, while GBP/USD rates had the greatest influence over the DXY Index despite only being the third largest component, falling by -1.38%.
Elsewhere, among non-DXY components, the greenback fared well: AUD/USD rates dropped by -1.59% and NZD/USD rates traded down by -0.72%. Mixed seasonal tendencies favor more of the choppy trading in the US Dollar, broadly speaking, over the rest of November.
US Economic Calendar Still Heavy
The shift into the middle of November will produce another full schedule of event risk based out of the US. After the October US NFP report, and now that the Fed’s communication blackout period is over, several Federal Reserve speakers will be in focus. Most of the significant events and data releases arrive in the first half of the week, ahead of Veteran’s Day on Thursday (federal holiday).
- On Monday, November 8, a trio of the top policymakers will give speeches, including Fed Vice Chair Clarida, Fed Chair Powell, and Fed Governor Bowman.
- On Tuesday, November 9, the October US produce price index (PPI) will be released, while Fed Chair Powell will issue more commentary.
- On Wednesday, November 10, weekly US MBA mortgage applications are due, as is the October US consumer price index (CPI). With a federal holiday the following day, weekly US jobless claims figures are set to be released. September US wholesale inventories figures are expected later in the morning, as well as weekly US energy inventory data. The October US monthly budget statement will be released in the afternoon.
- On Friday, November 12, the preliminary November US Michigan consumer sentiment survey is scheduled for publication.

Atlanta Fed GDPNow 4Q’21 Growth Estimate (November 4, 2021) (Chart 1)

Based on the data received thus far about 4Q’21, the Atlanta Fed GDPNow growth forecast is now at +8.5% annualized. The elevated forecast comes as “fourth-quarter real personal consumption expenditures growth and fourth-quarter real gross private domestic investment growth increased from 8.9% and 10.5%, respectively, to 9.4% and 11.0%, respectively, while the nowcast of the contribution of the change in real net exports to fourth-quarter real GDP growth decreased from -0.43% to -0.46%.”
The next update to the 4Q’21 Atlanta Fed GDPNow growth forecast is due on Wednesday, November 10 after US wholesale trade data and the US consumer price index are released.
For full US economic data forecasts, view the DailyFX economic calendar.
Less Hawkish Fed Expected After October US NFP
We can measure whether a Fed rate hike is being priced-in using Eurodollar contracts by examining the difference in borrowing costs for commercial banks over a specific time horizon in the future. Chart 2 below showcases the difference in borrowing costs – the spread – for the November 2021 and December 2023 contracts, in order to gauge where interest rates are headed by December 2023.
Eurodollar Futures Contract Spread (NOVEMBER 2021-DECEMBER 2023) [BLUE], US 2s5s10s Butterfly [ORANGE], DXY Index [RED]: Daily Chart (April 2021 to October 2021) (Chart2)
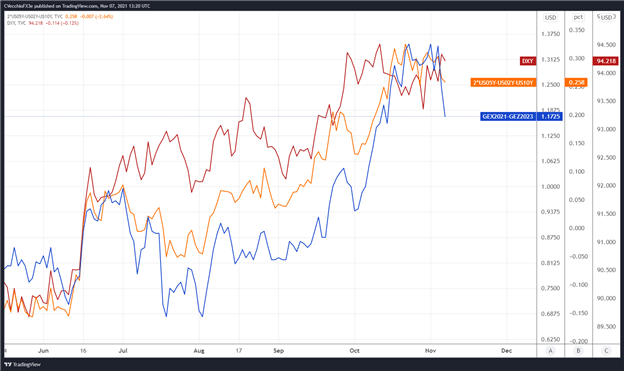
By comparing Fed rate hike odds with the US Treasury 2s5s10s butterfly, we can gauge whether or not the bond market is acting in a manner consistent with what occurred in 2013/2014 when the Fed signaled its intention to taper its QE program. The 2s5s10s butterfly measures non-parallel shifts in the US yield curve, and if history is accurate, this means that intermediate rates should rise faster than short-end or long-end rates.
While the above metric was indeed prescient in anticipating a more hawkish Fed at the November meeting, the relationship between the US Treasury yield curve and Eurodollar futures suggests that the market may have been too aggressive in its pricing about how quickly the Fed will act to raise rates once the taper is complete in the wake of Fed Chair Powell’s press conference and the October US NFP report.
There are 117-bps of rate hikes discounted through the end of 2023 while the 2s5s10s butterfly recently dropped from its widest spread since the Fed taper talk began in June (and its widest spread of all of 2021). This is a significant shift from when there were 133-bps of rates hikes priced in: whereas there was a 100% chance of five hikes and a 32% chance of six hikes, markets are now pricing in a 69% chance of five hikes and a 0% chance of six hikes.
US Treasury Yield Curve (1-year to 30-years) (November 2019 to November 2021) (Chart 3)
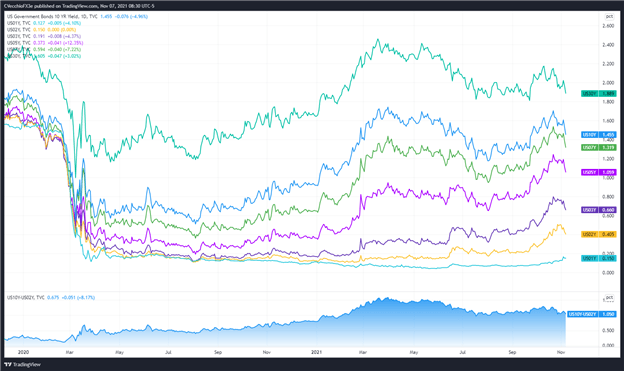
Historically speaking, the combined impact of falling US Treasury yields – particularly as intermediate rates outpace short-end and long-end rates – alongside dropping Fed rate hike odds has produced a mediocre if not unfavorable trading environment for the US Dollar.
CFTC COT US Dollar Futures Positioning (November 2020 to November 2021) (Chart 4)
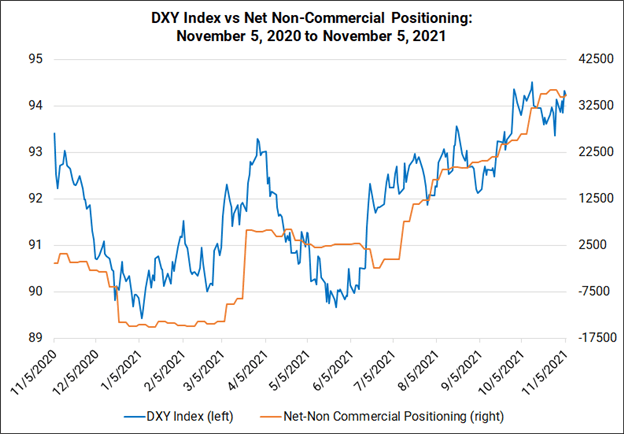
Finally, looking at positioning, according to the CFTC’s COT for the week ended November 2, speculators increased their net-long US Dollar positions to 34,964 contracts from 34,442 contracts. Net-long US Dollar positioning continues to hold near its highest level since the last week of November 2019.
--- Written by Christopher Vecchio, CFA, Senior Strategist


