


Mexican Peso Technical Price Outlook: USD/MXN Near-term Trade Levels
- Mexican Peso updated technical trade levels – Daily & Intraday Charts
- USD/MXN breakout testing major technical resistance- constructive above monthly open
- Risk for topside exhaustion sub-22.8983 – key near-term support 21.8979
The US Dollar has rallied more than 3.2% against the Mexican Peso in September with a breakout last week now taking USD/MXN into a major technical resistance confluence. While the medium-term focus remains constructive, the immediate advance may be vulnerable here and we’re on the lookout for possible topside exhaustion near-term. These are the updated targets and invalidation levels that matter on the USD/MXN technical price charts. Review my latest Strategy Webinar for an in-depth breakdown of this Peso technical setup and more.
Mexican Peso Price Chart – USD/MXN Daily

Chart Prepared by Michael Boutros, Technical Strategist; USD/MXN on Tradingview
Technical Outlook: In my last Mexican Peso Price Outlook we noted that USD/MXN had, “rallied back above confluence support but keep price within the confines of the near-term downtrend. From a trading standpoint, look for a reaction on a test of the upper parallels / 21.7560 for guidance with breach / close above the September range highs needed to suggest a larger reversal is underway.” A topside breach of the monthly opening-range high / September open, two-days later fueled another leg higher in price with USD/MXN now testing a critical zone at multi-month downtrend resistance.
The immediate focus is on 22.3223/33- a region defined by the objective weekly open and the 61.8% retracement of the late-June decline. Note that broader pitchfork resistance (blue) and basic trendline resistance (magenta) converge on this zone and while there have been numerous intraday attempts, price has yet to mark a daily close above this threshold. Look for a reaction here today with a close above keeping the focus on daily resistance objectives at the 38.2% retracement at 22.7250 and the June high / 50% retracement at 23.2287/3080. Monthly open support rests at 21.8779 with a close below 21.2317/2942 needed to mark resumption of the broader downtrend.
Mexican Peso Price Chart – USD/MXN 120min
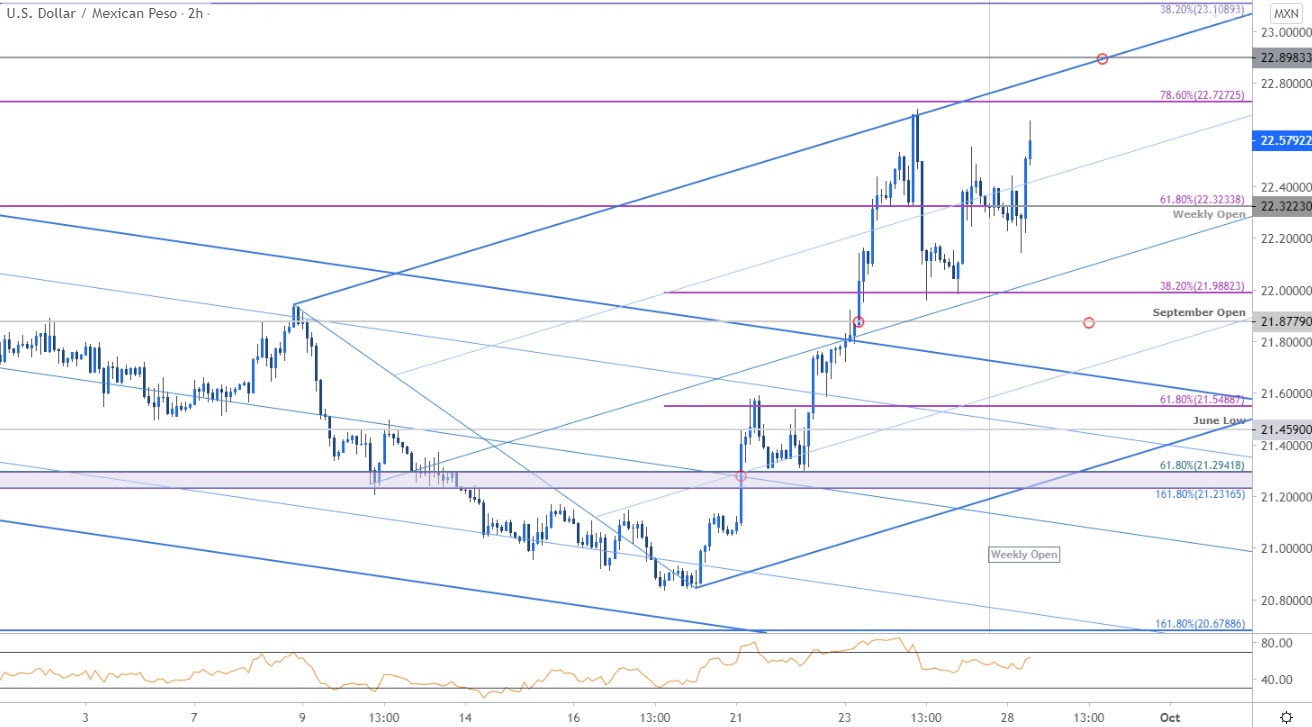
Notes: A closer look at Peso price action shows USD/MXN trading within the confines of an ascending pitchfork formation extending off the monthly lows with the most recent advance failing at the upper parallel last week. The immediate advance may be vulnerable into topside resistance objectives at 22.7273 and 22.8983- both levels of interest for exhaustion IF reached. Initial support rests at the median-line backed by the 38.2% retracement at 21.9882 and the monthly open at 21.8779- the medium-term outlook constructive while above this zone.

Bottom line: The USD/MXN rally is attempting to breach a major technical resistance confluence here- watch the close for confirmation. From a trading standpoint, look for possible topside exhaustion on a stretch towards near-term slope resistance- losses should be limited by the monthly open IF price is indeed heading higher. Ultimately, a pullback here may offer more favorable opportunities closer to trend support.
For a complete breakdown of Michael’s trading strategy, review his Foundations of Technical Analysis series on Building a Trading Strategy
---
Key US / Mexico Data Releases

Economic Calendar - latest economic developments and upcoming event risk.
Active Technical Setups
- Oil Price Outlook: Crude Caught at Resistance- WTI Breakout Pending
- S&P 500 Technical Outlook: Bears Challenge First Major Support
- Canadian Dollar Outlook: USD/CAD Breakout Levels- Bull’s First Test
- Australian Dollar Forecast: AUD/USD Plummets, Can Bulls Back the Bid?
- Gold Price Outlook: XAU/USD Rally Stalls– Relief or Reversal?
--- Written by Michael Boutros, Technical Strategist with DailyFX
Follow Michael on Twitter @MBForex


