


FTSE Technical Highlights:
- FTSE stabilizing, but can it continue?
- Short-term price action to determine next move
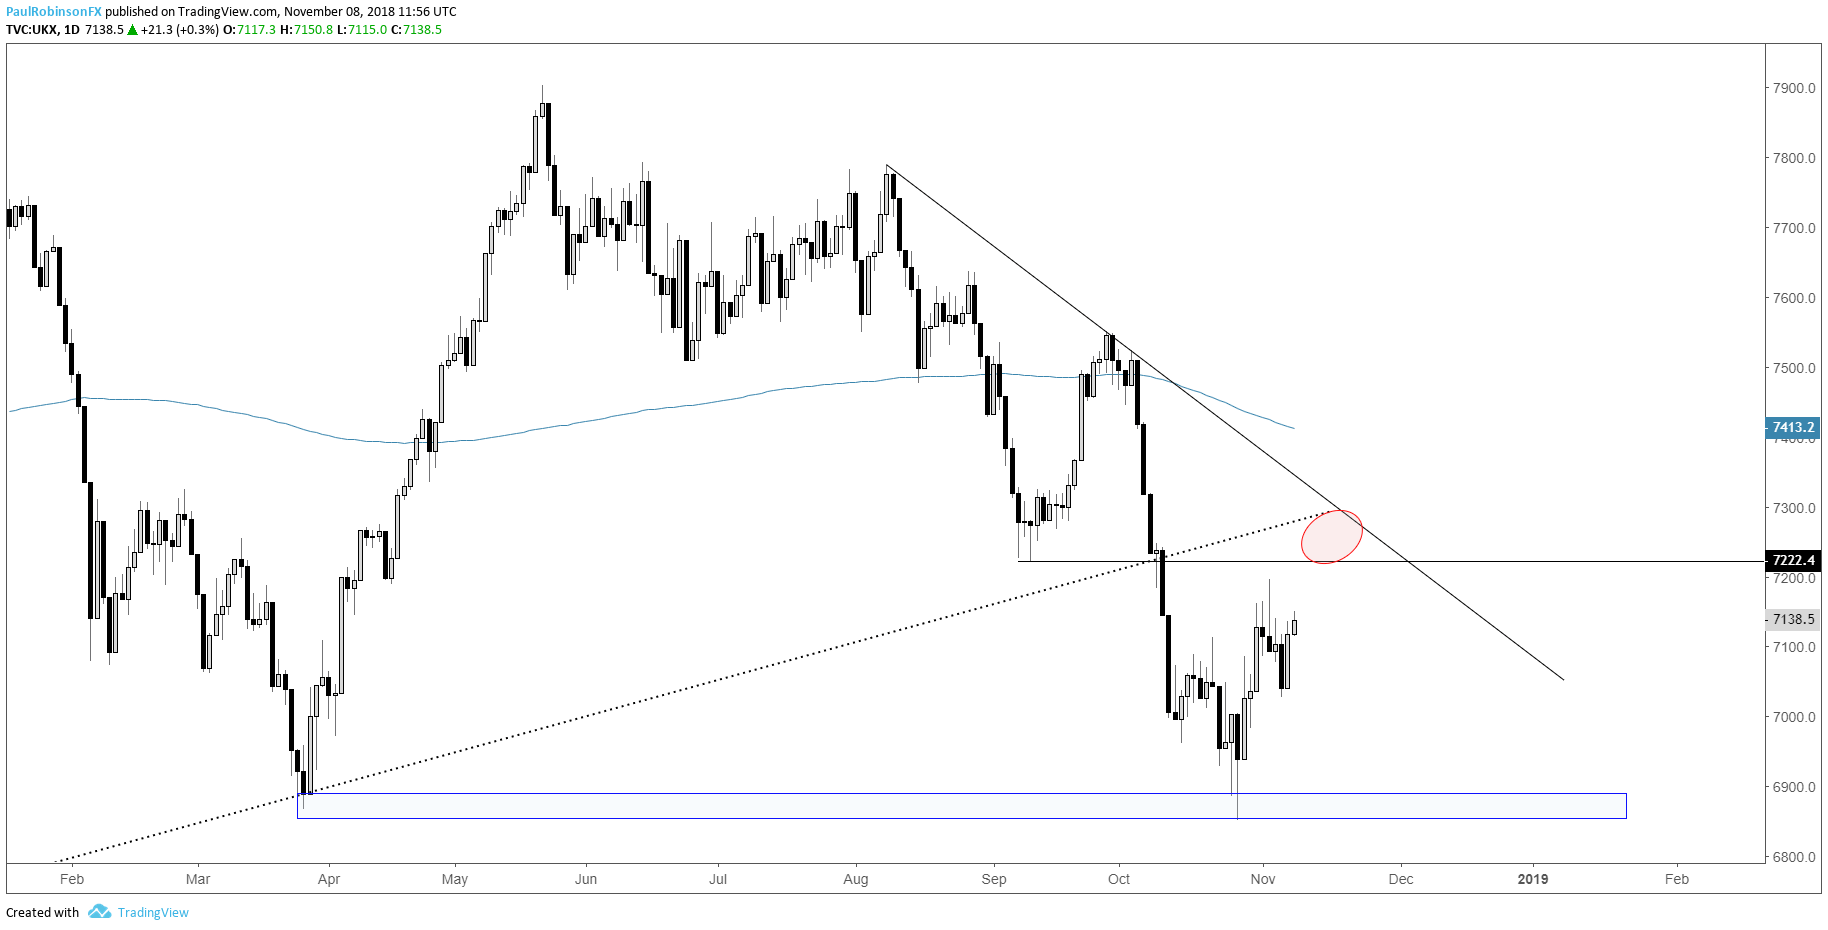
- Broader trend, bias still negative even on bullish outcome
Looking for forecasts, long-term trade ideas, and educational content? We got you covered. Check out the DailyFX Trading Guides page for details.
FTSE stabilizing, but can it continue?
The bounce off the lows hasn’t been as fierce as in other global markets, namely the U.S. But that isn’t all that surprising given the relative strength difference that has been going on for most the year. The FTSE and other European indices have been broadly weak, and while this is expected to continue in the intermediate-term, the near-term outlook could brighten up a little.
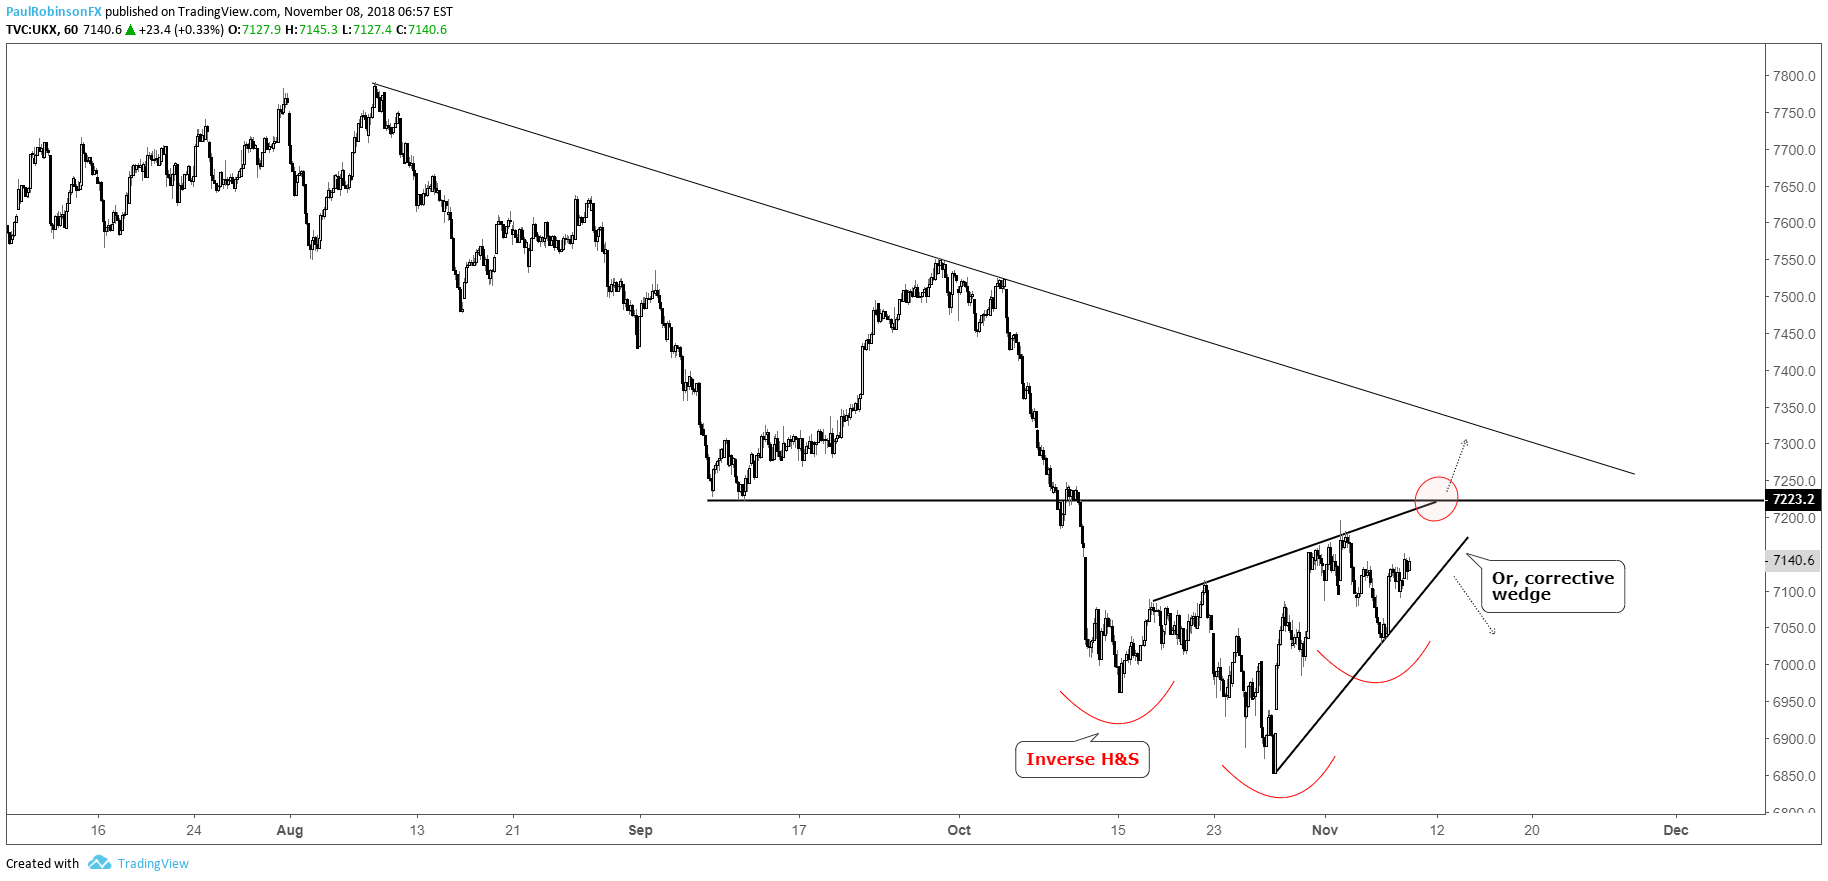
In yesterday’s indices/commodities webinar, we looked at the inverse head-and-shoulders pattern forming on the hourly time-frame for not only the FTSE, but also the DAX and CAC. The latter two indices have better defined patterns but the FTSE could still lift from the formation all the same.
The caveat is a) There is resistance right in the vicinity of the neckline and b.) Bigger resistance lies just beyond a break of the neckline. So while the FTSE could continue to recovery it isn’t without its obstacles to overcome, and it may end up a better set-up for shorts once a corrective bounce finishes than it is for would-be longs to try and take advantage of a rising market.
The alternate bearish route, which is often times seen with these types of patterns (H&S) when the neckline is tilted as it is, is for a wedge to form. While this could resolve itself upward just as the inverse H&S implies, it is more generally regarded as corrective in nature. With the trend pretty clearly down for some time now, a breakdown out of a well-developed wedge could have us looking at recent lows again, or worse, pretty quickly.
FTSE Daily Chart (Resistance ahead, trend negative)
Check out this guide for 4 ideas on how to Build Confidence in Trading.
FTSE Hourly Chart (Inverse H&S or corrective wedge)
You can join me every Wednesday at 10 GMT for live analysis on equity indices and commodities, and for the remaining roster of live events, check out the webinar calendar.
Tools for Forex & CFD Traders
Whether you are a beginning or experienced trader, DailyFX has several resources available to help you; indicator for tracking trader sentiment, quarterly trading forecasts, analytical and educational webinars held daily, trading guides to help you improve trading performance, and one specifically for those who are new to forex.
---Written by Paul Robinson, Market Analyst
You can follow Paul on Twitter at @PaulRobinsonFX


