


FTSE Technical Highlights:
- FTSE generally weak sitting near multi-month lows
- Solid near-term support just under 7500
- Long-term chart pattern revisited
To see what fundamental drivers and intermediate-term technical factors are driving the FTSE & British Pound, check out the DailyFX Q3 Trading Forecasts.
FTSE generally weak sitting near multi-month lows
The FTSE continues to demonstrate relative weakness among major global indices, lately performing a bit worse than its Euro-zone counterparts (DAX/CAC) and considerably worse than the U.S., which is running to new heights (S&P 500, Nasdaq 100).
Indeed, there is glaring divergence right now between several major global equity markets and the U.S. Turning to Asia, the Nikkei is sitting a good distance from it’s January highs, too, struggling to get to its best levels since May.
What does this all mean for the FTSE? The relative weakness suggests that if the struggles continue, when (if) risk appetite weakens in the world’s largest stock market, we could see the footsie trade sharply lower. We saw something like this happen from January to March.
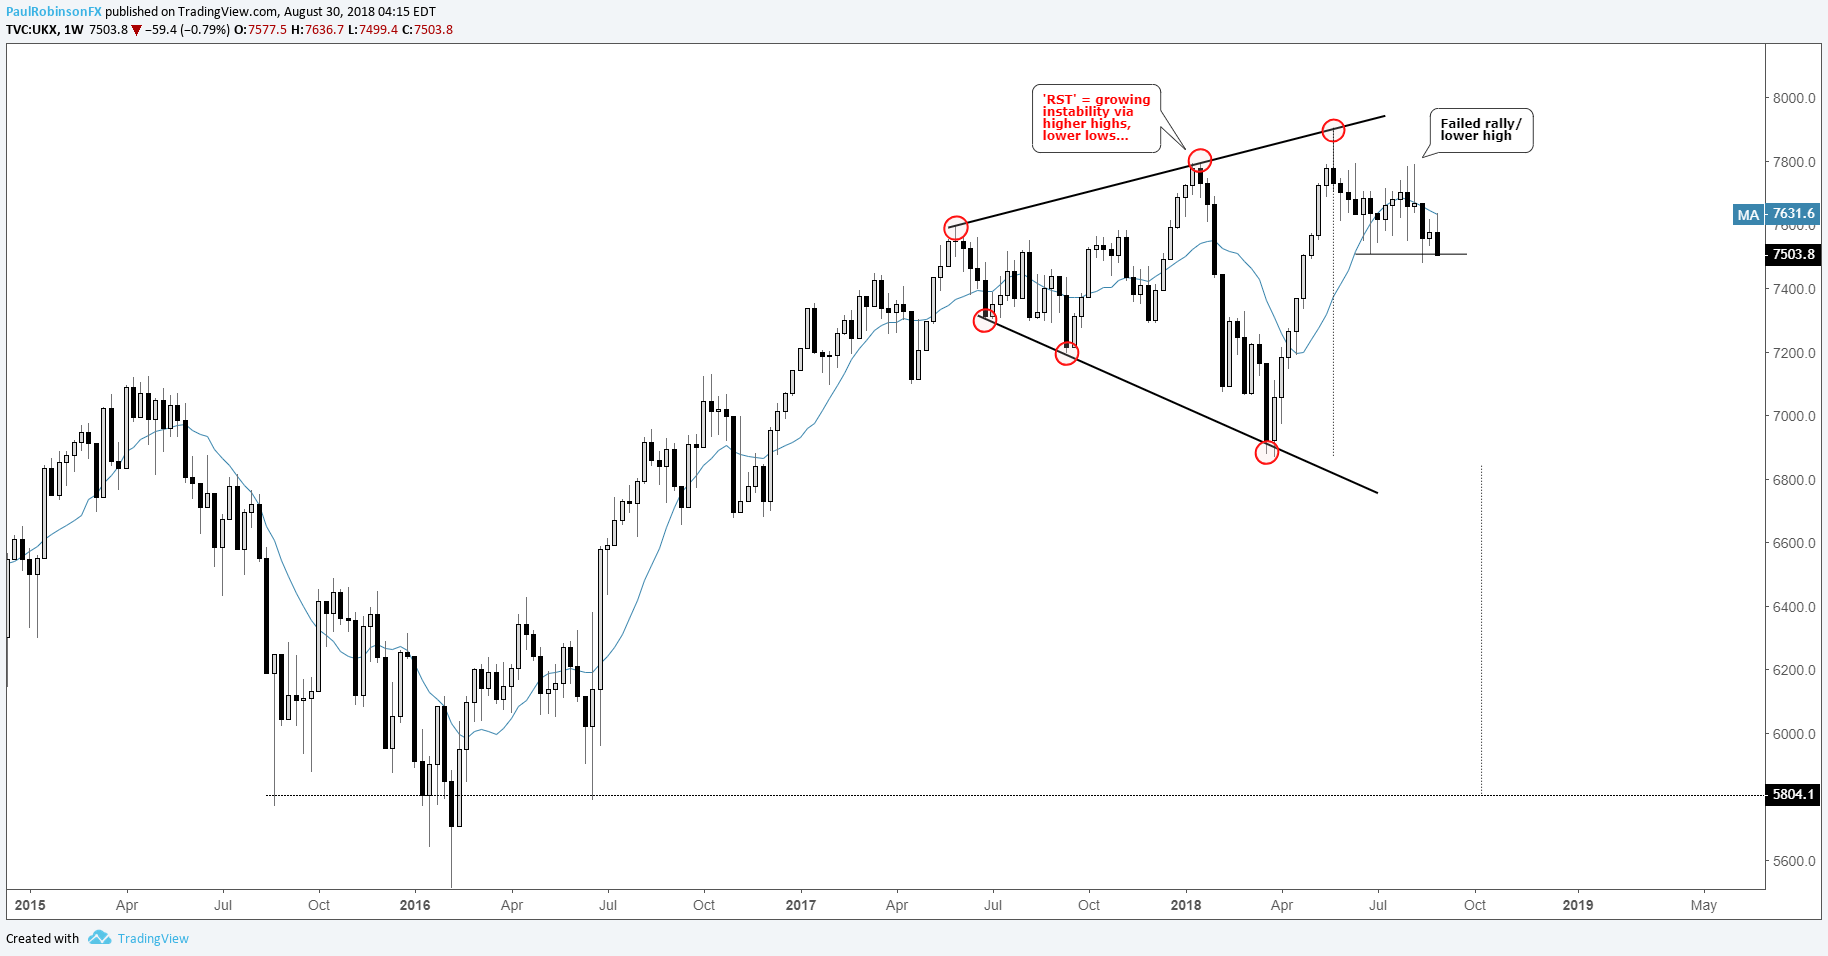
Long-term Chart Pattern Revisited
This brings us to the long-term pattern we discussed a couple of weeks back. The Reverse Symmetrical Triangle, or ‘RST’, that has been developing since June of last year is starting to point to a broad reversal. Looking at the weekly, the initial pullback in May/June led to a failed rally into this month, which is now rolling over towards another lower low.
The pullback, failed rally scenario is typically the sign of an ‘RST’ becoming a reversal pattern and not one which leads to a continuation. We have yet to see a close below the June weekly low of 7508, but if we do (and recent 7477 low) it will further along the notion that the FTSE is on the verge of declining much more swiftly soon.
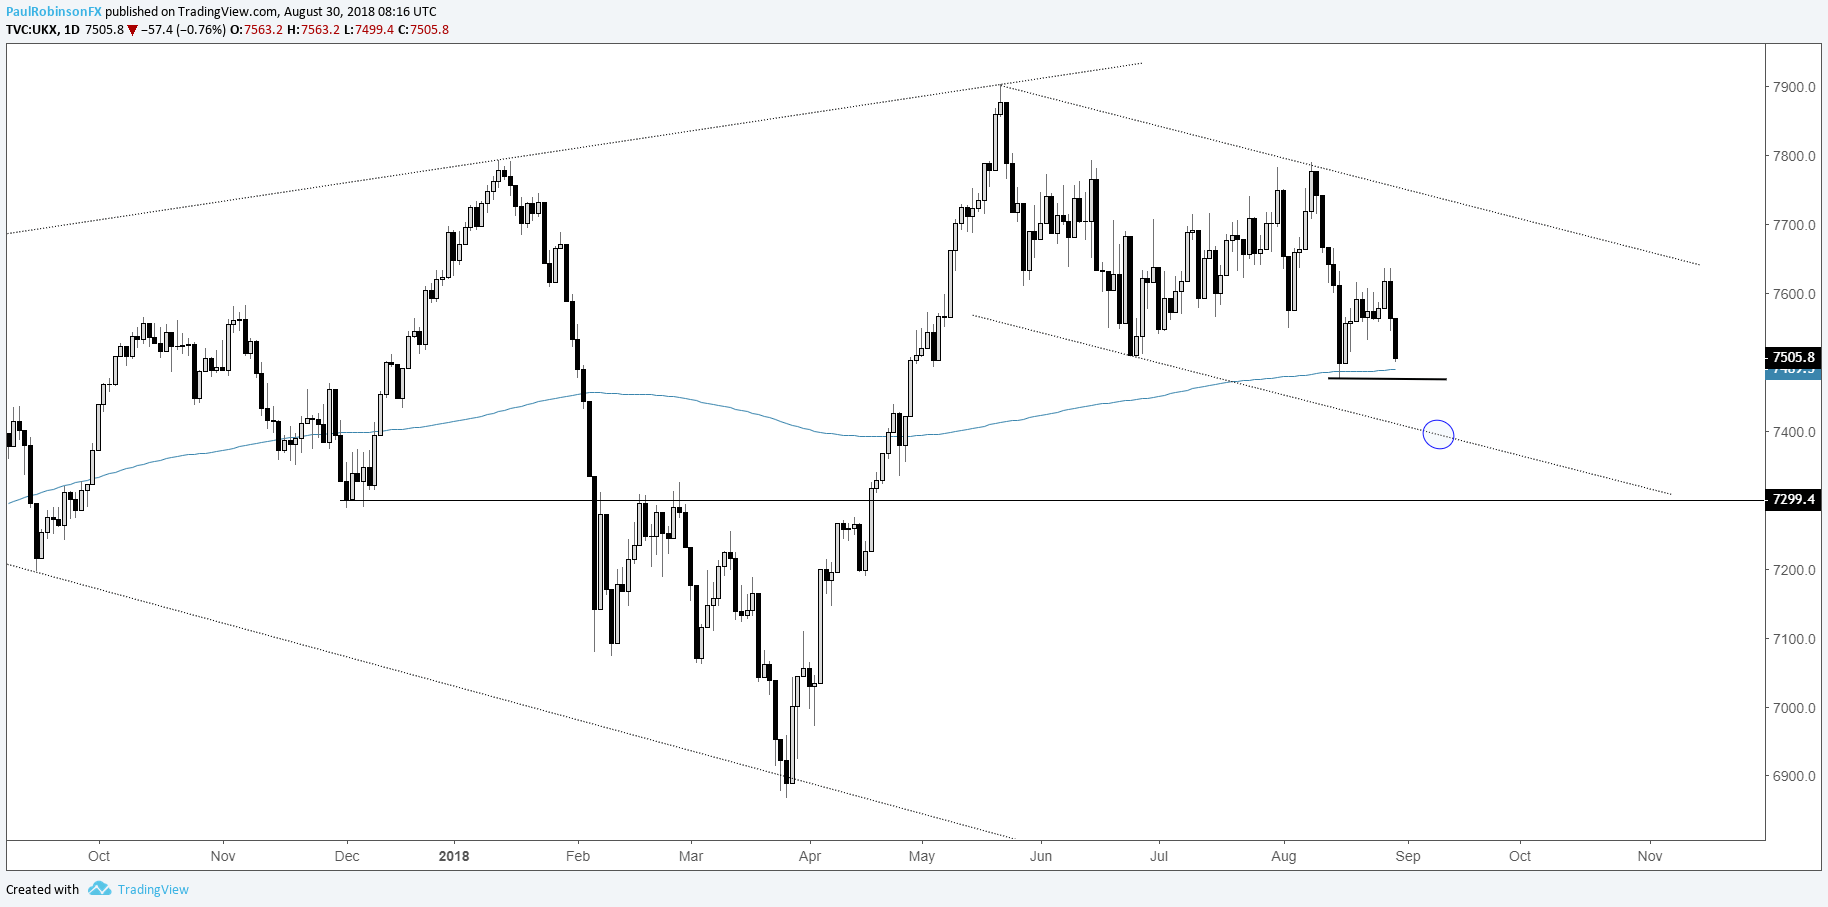
In the immediate future there is the low from the week before last and 200-day MA, if a decline below 7477 develops look for more immediate selling. There is a lower parallel under 7400 which may provide near-term support, though, and with trading conditions generally choppy heading into the end of summer, playing momentum in either direction isn’t a prudent approach. Entries will likely be best kept to counter-trend moves…
Check out this guide for 4 ideas on how to Build Confidence in Trading.
FTSE Weekly Chart (RST Pattern)
FTSE Daily Chart (Support at feet)
You can join me every Tuesday at 9 GMT for live analysis on equity indices and commodities, and for the remaining roster of live events, check out the webinar calendar.
Tools for Forex & CFD Traders
Whether you are a beginning or experienced trader, DailyFX has several resources available to help you; indicator for tracking trader sentiment, quarterly trading forecasts, analytical and educational webinars held daily, trading guides to help you improve trading performance, and one specifically for those who are new to forex.
---Written by Paul Robinson, Market Analyst
You can follow Paul on Twitter at @PaulRobinsonFX


