


S&P 500, Nasdaq Technical Price Outlook: Near-term Trade Levels
- S&P 500 technical trade level update – Daily & Intraday Charts
- SPX500, Nasdaq recoveries now approaching downtrend resistance
- SPX key resistance 4417, support 4197- NDX key resistance 14478, support 13948
The S&P 500 rally has now extended nearly 7% with the advance taking the index towards broader downtrend resistance. A similar scenario is shaping up in the Nasdaq and the focus is on a possible breakout here to suggest a more significant low was registered last week in stocks. These are the targets and invalidation levels that matter on the SPX500 technical price charts heading into the close of the week. Review my latest Strategy Webinar for an in-depth breakdown of this SPX500 setup and more.
S&P 500 Price Chart – SPX500 Daily

Chart Prepared by Michael Boutros, Technical Strategist; SPX500 on Tradingview
Technical Outlook: In my last S&P 500 technical outlook we noted that SPX was approaching key support at the, “23.6% retracement of the entire 2020 advanve at 4197- look for a larger reaction there for guidance IF reached (an area of interest for possible downside exhuastion). It’s important to note that weakness beyond this threshold would risk substantial losses for the index towards initial support objectives at 4142 and the May low-day close at 4117.” The index registered a low at 4105 before reversing sharply into the close of the week and the focus now shifts to downtrend resistance just higher.
S&P 500 Price Chart – SPX500 120min
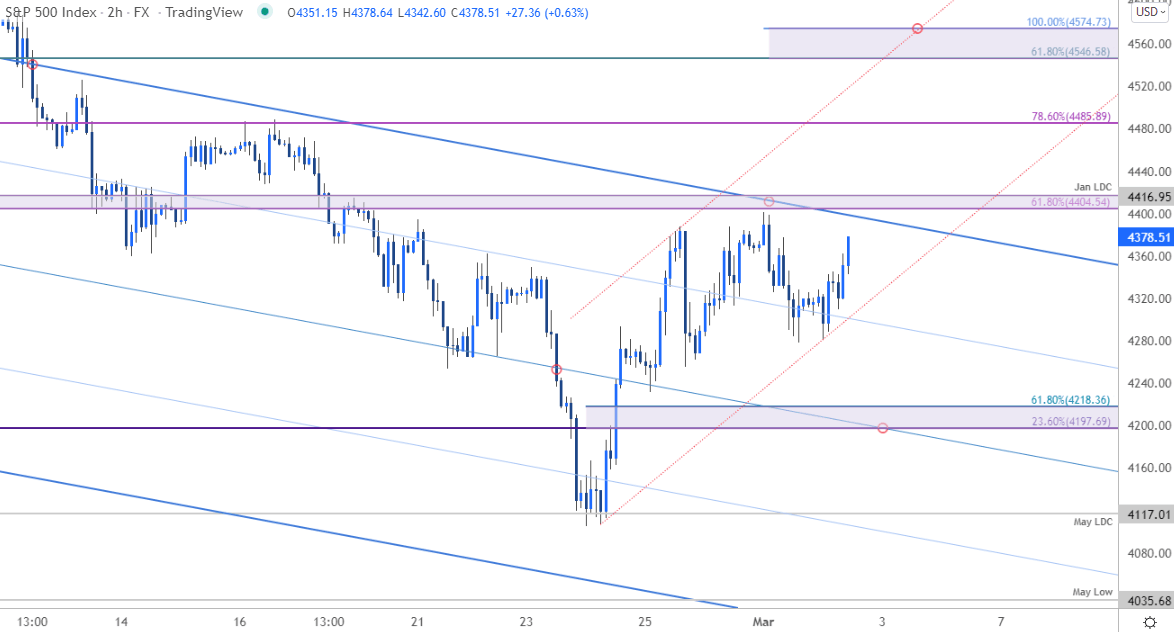
Chart Prepared by Michael Boutros, Technical Strategist; SPX500 on Tradingview
Notes: A closer look at SPX500 price action shows the index holding tight support at 4117 with the a break above the median-line now approaching confluence resistance at 4404/17 – a region defined by the 61.8% Fibonacci retracement of the February decline and the January low-day close. A breach / daily close above this threshold would be needed to suggest a more significant low was registered last week with such a scenario exposing subsequent resistance objectives at 4485 and a more significant technical confluence at 4546/74- look for a larger reaction there IF reached.
Initial support now rests with the trendline (red) extneding off the lows (currently ~4300) with key near-term supoprt at 4197-4218. Weakness beyond this zone could fuel another bout of accelerated losses towards fresh lows- downside supoprt objectives unchaned at the May low at 4035 and the 100% extension of the 2022 decline at 3995(an area of interest for downside exhaustion IF reached).

Bottom line: The S&P 500 recovery off downtrend support is now approaching downtrend resistance- looking for possible price inflection into 4404/17. From a trading standpoint, a good zone to reduce long-exposure / raise protective stops. Losses should be limited to 4200 IF price is heading higher on this stretch. Keep an eye on the headlines coming out of Ukraine with US non-farm payrolls (NFP) still on tap Friday- stay nimble here. Review my latest S&P 500, Nasdaq & Dow Weekly Technical Forecast for a closer look at the longer-term SPX500 technical trade levels.
For a complete breakdown of Michael’s trading strategy, review his Foundations of Technical Analysis series on Building a Trading Strategy
S&P 500 Trader Sentiment – US500 Price Chart

- A summary of IG Client Sentiment shows traders are net-long the S&P 500- the ratio stands at +1.48 (59.71% of traders are long) – typically a weak bearishreading
- Long positions are5.02% higher than yesterday and 6.46% lower from last week
- Short positions are 7.04% lower than yesterday and 9.15% lower from last week
- We typically take a contrarian view to crowd sentiment, and the fact traders are net-long suggests US 500 prices may continue to fall. Traders are further net-long than yesterday and last week, and the combination of current positioning and recent changes gives us a stronger US 500-bearish contrarian trading bias from a sentiment standpoint.

Nasdaq 100 Price Chart – NDX Daily

Chart Prepared by Michael Boutros, Technical Strategist; NDX on Tradingview
Notes: A similar stance here with the Nasdaq recovery now holding just below the 75% parallel. A breakout here would look for a challenge of key resistance at the July low / 38.2% retracement of the November decline at 14455/478 – look for a larger reaction there with a close above needed to validate a near-term breakout in price. Initial support now at 13949 with key support at the close low neat 13502- losses below this threshold would threaten a deeper run towards the 38.2% retracement of the 2020 rally at 12947. Bottom line, look for a reaction into downtrend resistance for guidance here.
US Economic Calendar

Economic Calendar - latest economic developments and upcoming event risk.
Active Technical Setups
- Gold Price Technical Outlook: Gold War Bid Drives as Conflict Escalates
- US Dollar Technical Outlook: USD Rips as War Erupts in Europe
- Australian Dollar Technical Outlook: Aussie Bulls Eye Key Resistance
- Canadian Dollar Technical Outlook: USD/CAD Coiling- Breakout Imminent
-Written by Michael Boutros, Currency Strategist with DailyFX
Follow Michaelon Twitter @MBForex


