


S&P 500 PRICE OUTLOOK: VIX INDEX ‘FEAR-GAUGE’ PRESSURED AS STOCKS MAINTAIN KEY TECHNICAL LEVEL
- S&P 500 declined for the second consecutive trading session as equities oscillate
- Stocks look boxed in between key trade levels of technical support and resistance
- VIX Index, or fear-gauge, remains bid owing to heightened investor uncertainty
Stocks stumbled for the second day in a row with major stock indices like the S&P 500, Dow, and Nasdaq trading lower by 0.8%, 0.5%, and 1.3% respectively. Investors have steered equities lower for back-to-back declines following the September FOMC meeting, which appears to have disappointed dovish expectations. It is also possible that chilling commentary on the US economy from Fed Chair Powell has contributed to recent weakness exhibited by S&P 500 price action.
S&P 500 PRICE CHART: DAILY TIME FRAME (17 APR TO 17 SEP 2020)
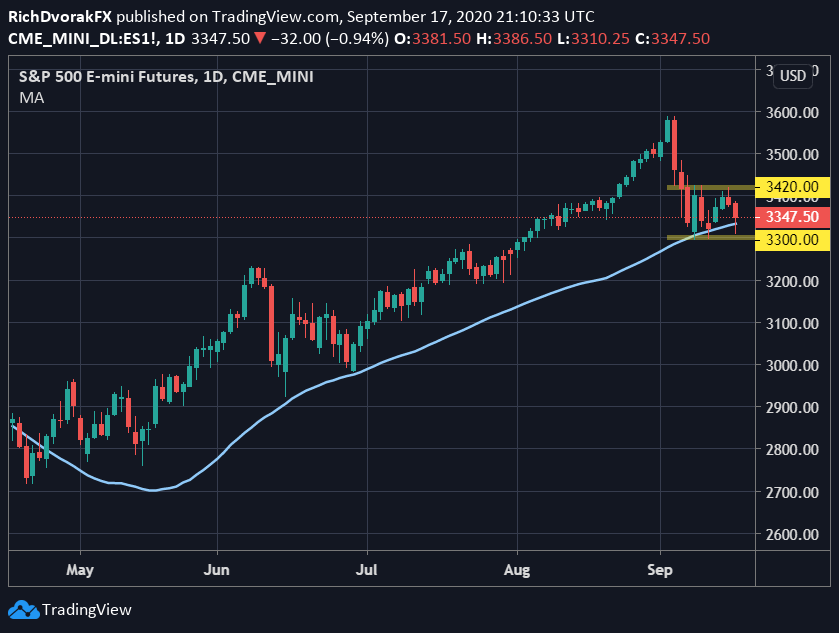
Chart created by @RichDvorakFX with TradingView
It seems that stock market traders are still keen on ‘buying the dip,’ however, as the S&P 500 prints a string of higher lows around the 3,300-price level. This area of technical support is roughly highlighted by the 50-day moving average, which could help keep stocks bolstered. That said, a breakdown below this key area of confluence might accelerate S&P 500 selling pressure. Resistance looms large overhead near the 3,420-mark, but eclipsing this technical barrier could encourage equity bulls to set their sights back on all-time highs.

VIX INDEX PRICE CHART WITH S&P 500 OVERLAID: DAILY TIME FRAME (DEC 2019 TO SEP 2020)
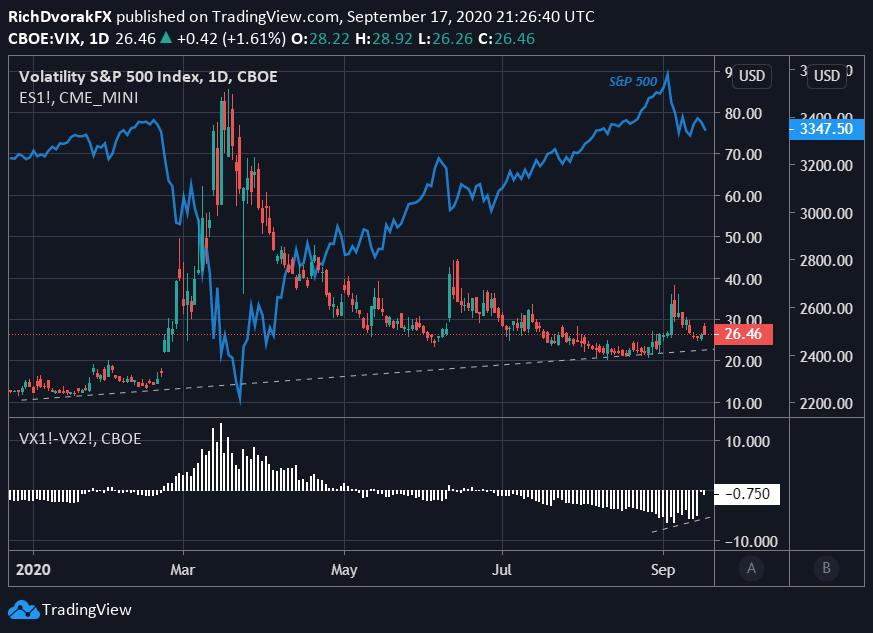
Chart created by @RichDvorakFX with TradingView
Defending the formidable technical support level around 3,300 likely helped spur trader risk appetite as the session progressed. With stocks holding weekly and month-to-date lows, the VIX Index, or fear-gauge, pulled back markedly from its intraday spike. Expected stock market volatility has trended higher, however, and is a big theme that could gain traction as the upcoming US presidential election nears. Also, looking to the DailyFX Economic Calendar brings to focus the release of monthly consumer sentiment data standing to make an impact on trader risk appetite tomorrow.
| Change in | Longs | Shorts | OI |
| Daily | 1% | -1% | 0% |
| Weekly | 15% | -13% | -1% |
Not to mention, Friday’s trading session brings quadruple witching, which is the simultaneous expiry of options and futures on equity indices and individual stocks. This roll event has potential to exacerbate volatility and swings across the market. To that end, the front-month VIX Index futures contract, is set to roll to the October contract, which trades notably higher. This could put upward pressure on the VIX Index while weighing negatively on S&P 500 price action, particularly if investors continue to seek out and pay premium for downside protection via the VIX Index.
Keep Reading: Crude Oil Price Climbs to Test 50-DMA in Wake of OPEC+ Update
-- Written by Rich Dvorak, Analyst for DailyFX.com
Connect with @RichDvorakFX on Twitter for real-time market insight


