


OIL PRICE OUTLOOK: CRUDE OIL REBOUNDS INTO RESISTANCE AMID OPEC+ REPORT
- Oil price action responded positively to the latest OPEC+ update from top energy ministers
- The commodity has advanced 10% so far this week but still trades down month-to-date
- An ominous back-test of the 50-day moving average could undermine the rebound by crude
Crude oil has clawed back recent losses over the last three trading sessions. Oil price action now trades about 10% higher this week, but the commodity is still lower on a month-to-date basis. A recovery in market sentiment, indicated by stagnating selling pressure across major stock indices, likely helped provide buoyancy to crude oil.

Speculation headed into the latest OPEC+ update may have boosted petroleum prices as well. Top energy ministers comprising the JMMC gathered to discuss latest oil market outlook and review production quota compliance. Crude oil was jawboned higher with commentary stating ‘further necessary measures may be needed’ in light of slumping demand as the global economic recovery stalls.
CRUDE OIL PRICE CHART: 4-HOUR TIME FRAME (25 AUG TO 17 SEP 2020)

Chart created by @RichDvorakFX with TradingView
Remarks from Saudi Prince Abdulaziz, who said “I will make this market jumpy,” might have scared oil shorts with weak hands as the energy minister doubled down on his remarks with additional expletives. Further, the JMCC suggested to OPEC officials that the compensation period for overproduction be extended through year-end, which could encourage more conformity among the oil cartel and facilitate market stability.

Crude oil could struggle to extend its rebound, however, as the commodity clashes with a critical zone of technical resistance around the $41.00-price level. This area of confluence is highlighted by the 61.% Fibonacci retracement of last month’s high to this month’s low. Also, the relative strength index is perched on the edge of ‘overbought’ territory.
CRUDE OIL PRICE CHART: DAILY TIME FRAME (23 APR TO 17 SEP 2020)
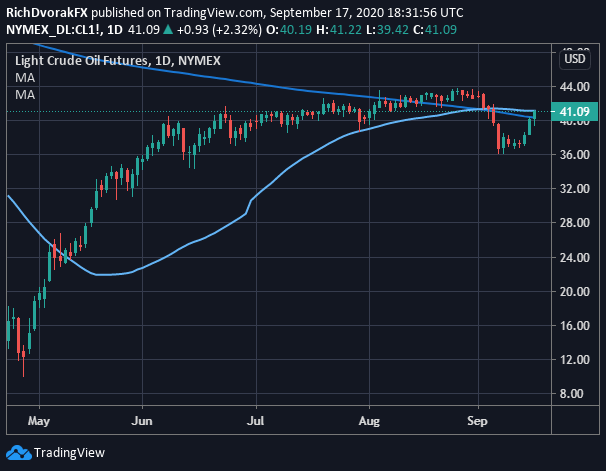
Chart created by @RichDvorakFX with TradingView
Not to mention, a bearish moving average ‘death-cross’ potentially looms, and threatens to send crude oil price action lower. Reclaiming the 200-day moving average could serve as an encouraging technical development for oil bulls, but a back-test of the 50-day moving average could keep a lid on further advances attempted by the commodity.
| Change in | Longs | Shorts | OI |
| Daily | 3% | -7% | 1% |
| Weekly | 31% | -38% | 7% |
CRUDE OIL PRICE CHART & VIX INDEX OVERLAID: DAILY TIME FRAME (27 APR TO 17 SEP 2020)

Chart created by @RichDvorakFX with TradingView
Oil price may nevertheless mirror the direction of expected market volatility gauged by the S&P 500 VIX Index, or ‘fear-gauge.’ Crude oil and the VIX Index tend to move in opposite direction as illustrated by their generally-strong negative correlation. A higher VIX Index level suggests greater risk aversion as traders seek downside protection, which would likely be associated with a breakdown in broader sentiment and economic conditions. In turn, this could correspond with bearish headwinds for oil price action. Although, if the VIX ‘fear-gauge’ reverts back lower, the price of crude oil could approach August highs near the $43.00-handle.
-- Written by Rich Dvorak, Analyst for DailyFX.com
Connect with @RichDvorakFX on Twitter for real-time market insight


