


What’s inside:
- The S&P 500 remains amid the historically tight trading range
- Failure to break to the upside increases likelihood of a down-side break
- Bearish factors still in play
Recently, we discussed the risk of seeing the painfully tight trading range in the S&P 500 result in an initial fake-out once it was broken.
From yesterday’s commentary: “In overnight trade the S&P moved above the top-side of the range set at 2174/78, but is now falling back to retest. A hold here will be important as a drop back inside will increase the likelihood of seeing a move to the low-end of the range in the 2155/60 area or worse.”
It wasn’t long into the U.S. session, yesterday, we saw the S&P 500 drop back inside to the middle of the range after trading briefly above it.
In overnight trade, there was a push higher back to the top of the range at the 2174/78 band, but resistance proved to be just that as sellers emerged. The low-end of the range is clearly exposed and a probe and break of support could soon unfold.
Given how elongated the range had become and the fact the market’s first attempt to break to the upside was a failure, suggests that the next extended move could come on a break of support in the 2155/60 area.

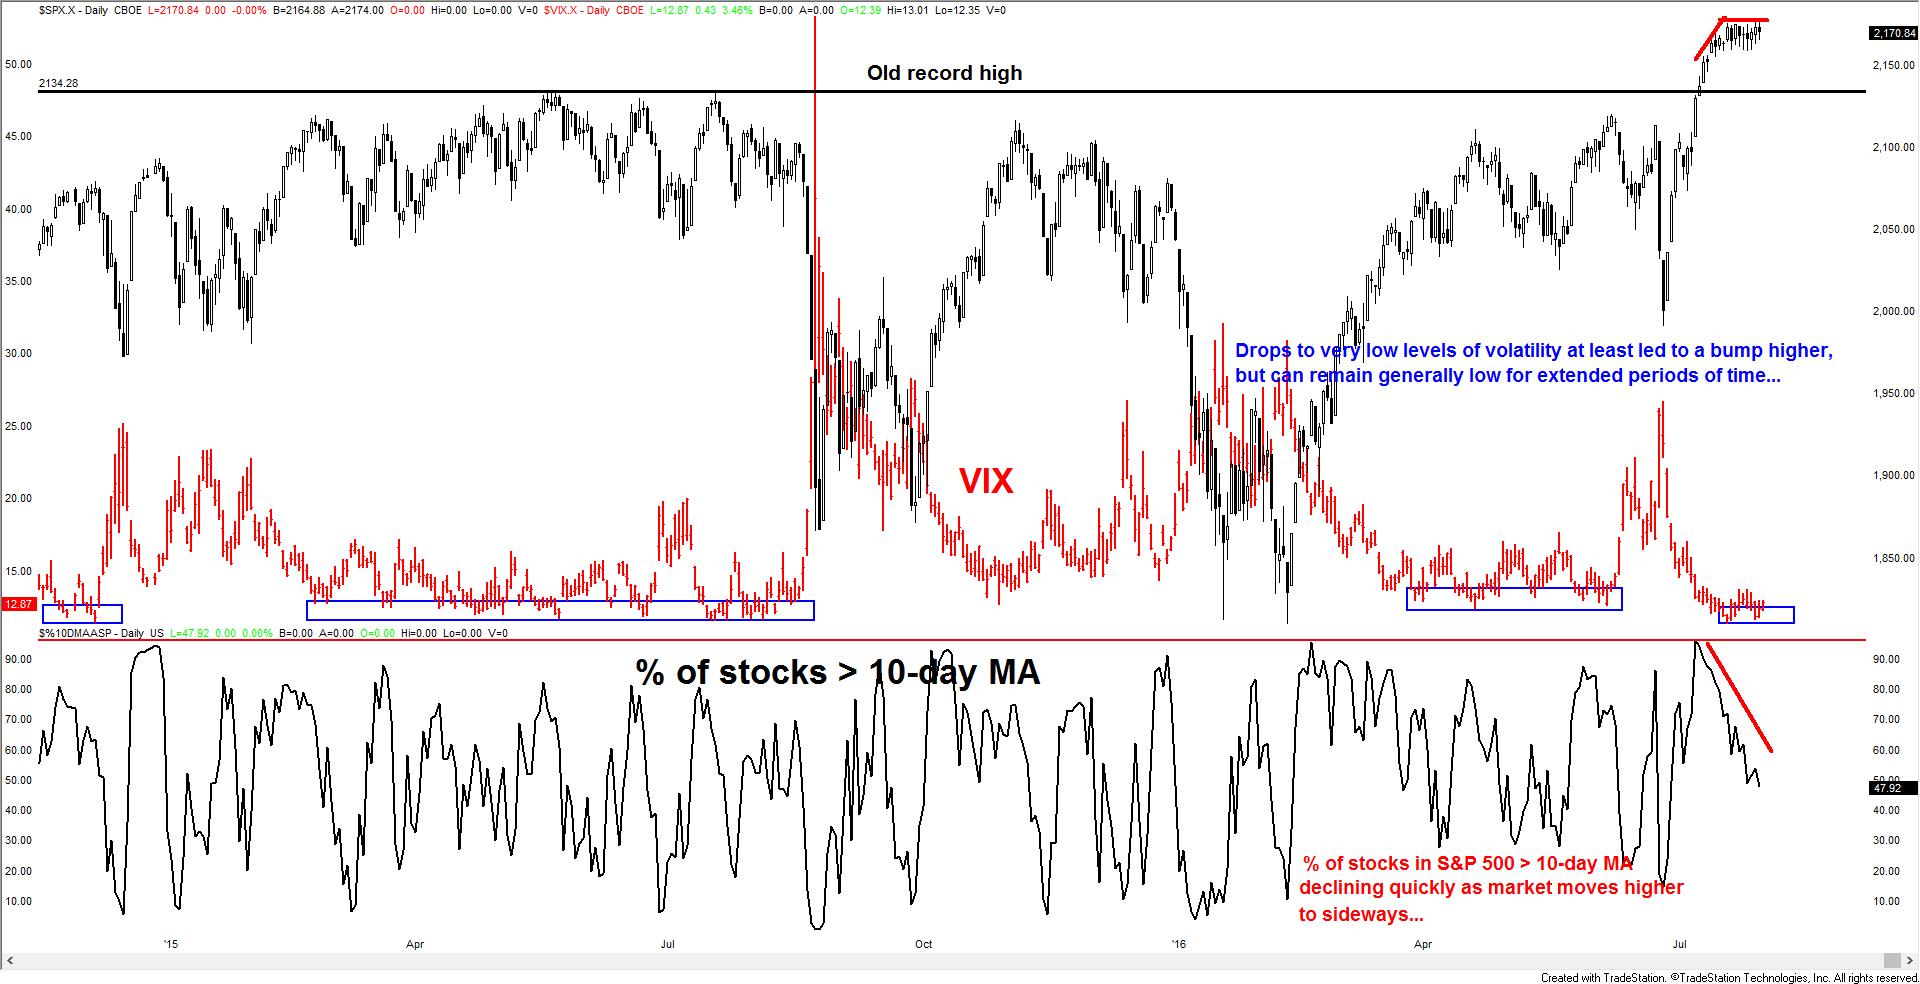
Still supporting the case for the down-side is the fact the market continues to hold sideways while the percentage of stocks in the S&P 500 doing so continues to trend lower.
Additionally, the VIX remains very depressed and due for a bump higher. Yesterday, we discussed August as a month which kicks off a season of higher volatility, but even if that is to be put on hold until later, a small kick higher in the VIX can be expected, even if short-lived.
Thirdly, the propensity over the years for the market to decline back below the previous record high shortly after making a new one remains a tendency we believe will play out.
For more details: Failures following record highs (here), bearish volatility and breadth (here).
S&P 500 w/VIX & %Stocks >10-day MA
The market is searching for direction, and as each side of the market gets tested, eventually one or the other will gain control. Buyers had their chance to gain the upper hand, now it is the sellers turn to see if they can take over.
Learn how to improve your skills in taking an idea from concept to execution in our trading guide, “Traits of Successful Traders”.
---Written by Paul Robinson, Market Analyst
You can follow Paul on Twitter at @PaulRobinsonFX.
You can email him at instructor@dailyfx.com with any questions or comments.


