


DAX/CAC Technical Highlights:
- DAX trading in a wide range that needs to be resolved
- CAC broke channel support from early in the year
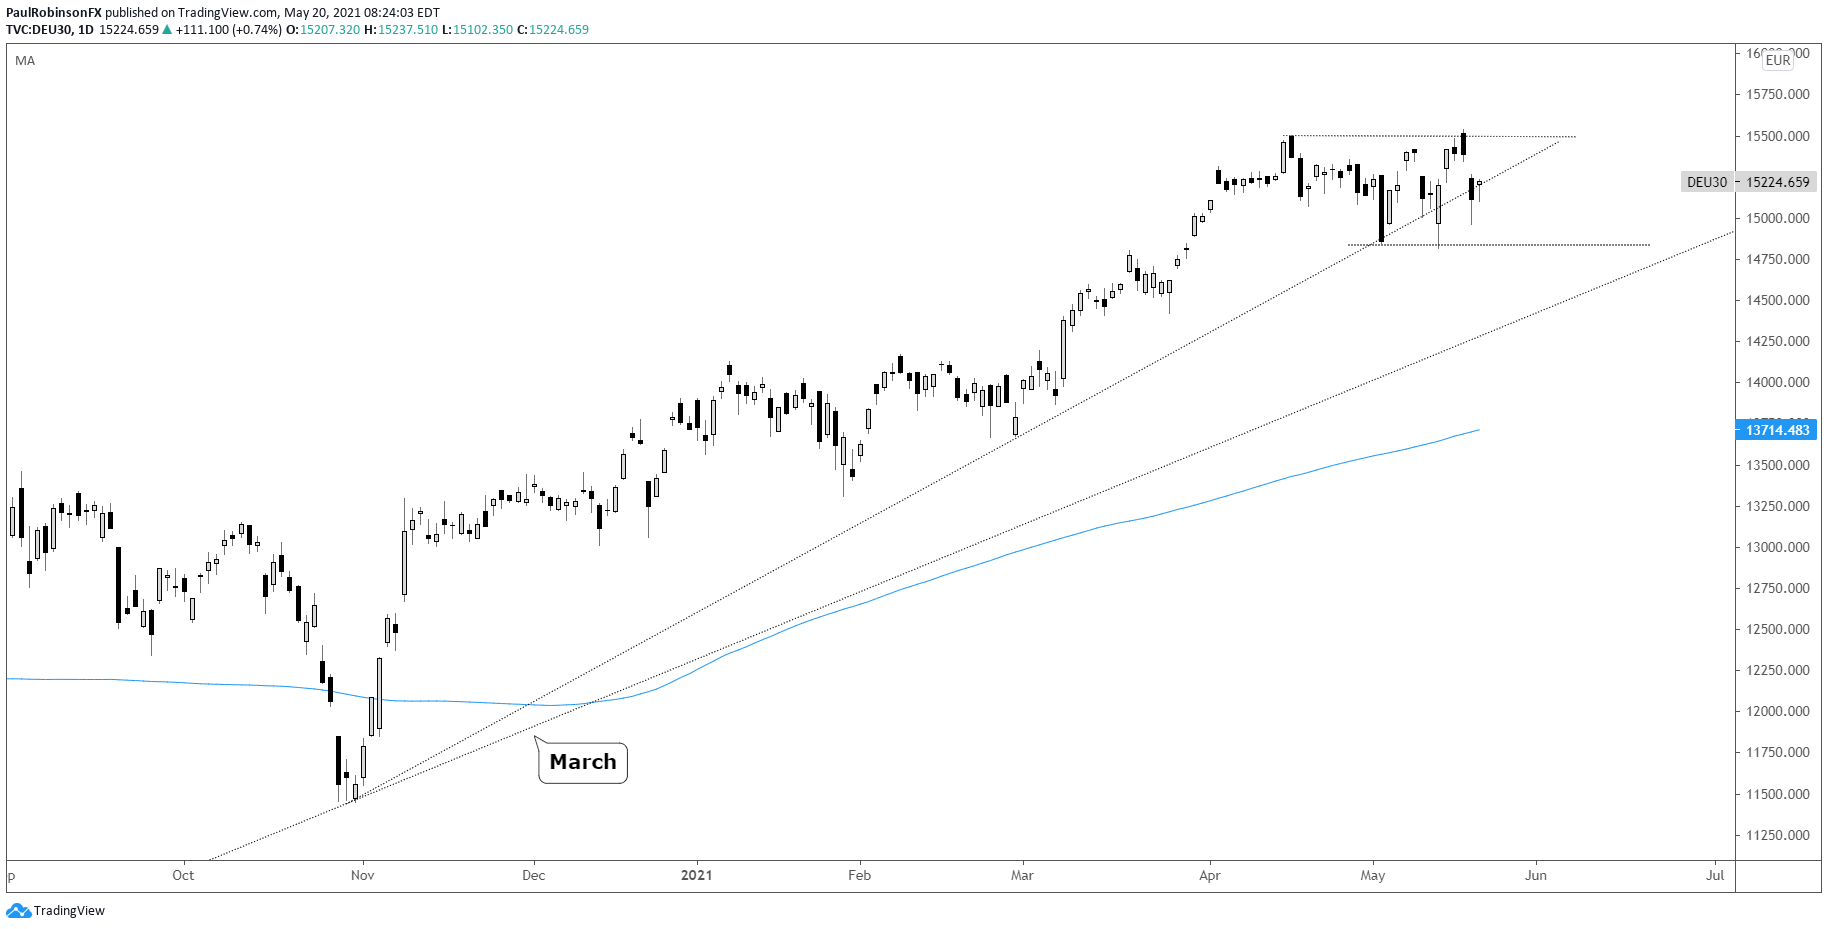
The DAX has been swinging back and forth in a range between 14816 and the record high at 15538, leaving the market in limbo until one side or the other breaks. Giving the trend the benefit of the doubt and the loosely held late October trend-line, it appears a resolution is coming on the top-side.
But this of course can change quickly as every couple of days the market looks poised to either rip or tank. This could go on a while longer before we get a resolution, or it could happen quickly. Predicting the when and what direction isn’t our job.
We need to be ready to react when the time comes. A breakout above 15538 on a daily closing basis will be viewed as the cue to take a more aggressive bullish stance. Given the size of the range and volatility a 700 point rally from there is within reasonable expectations.
Should the bottom of the range break, then look for the March 2020 trend-line to come into play, currently it resides around the 14400 level.

DAX Daily Chart (needs to break out of volatile range)
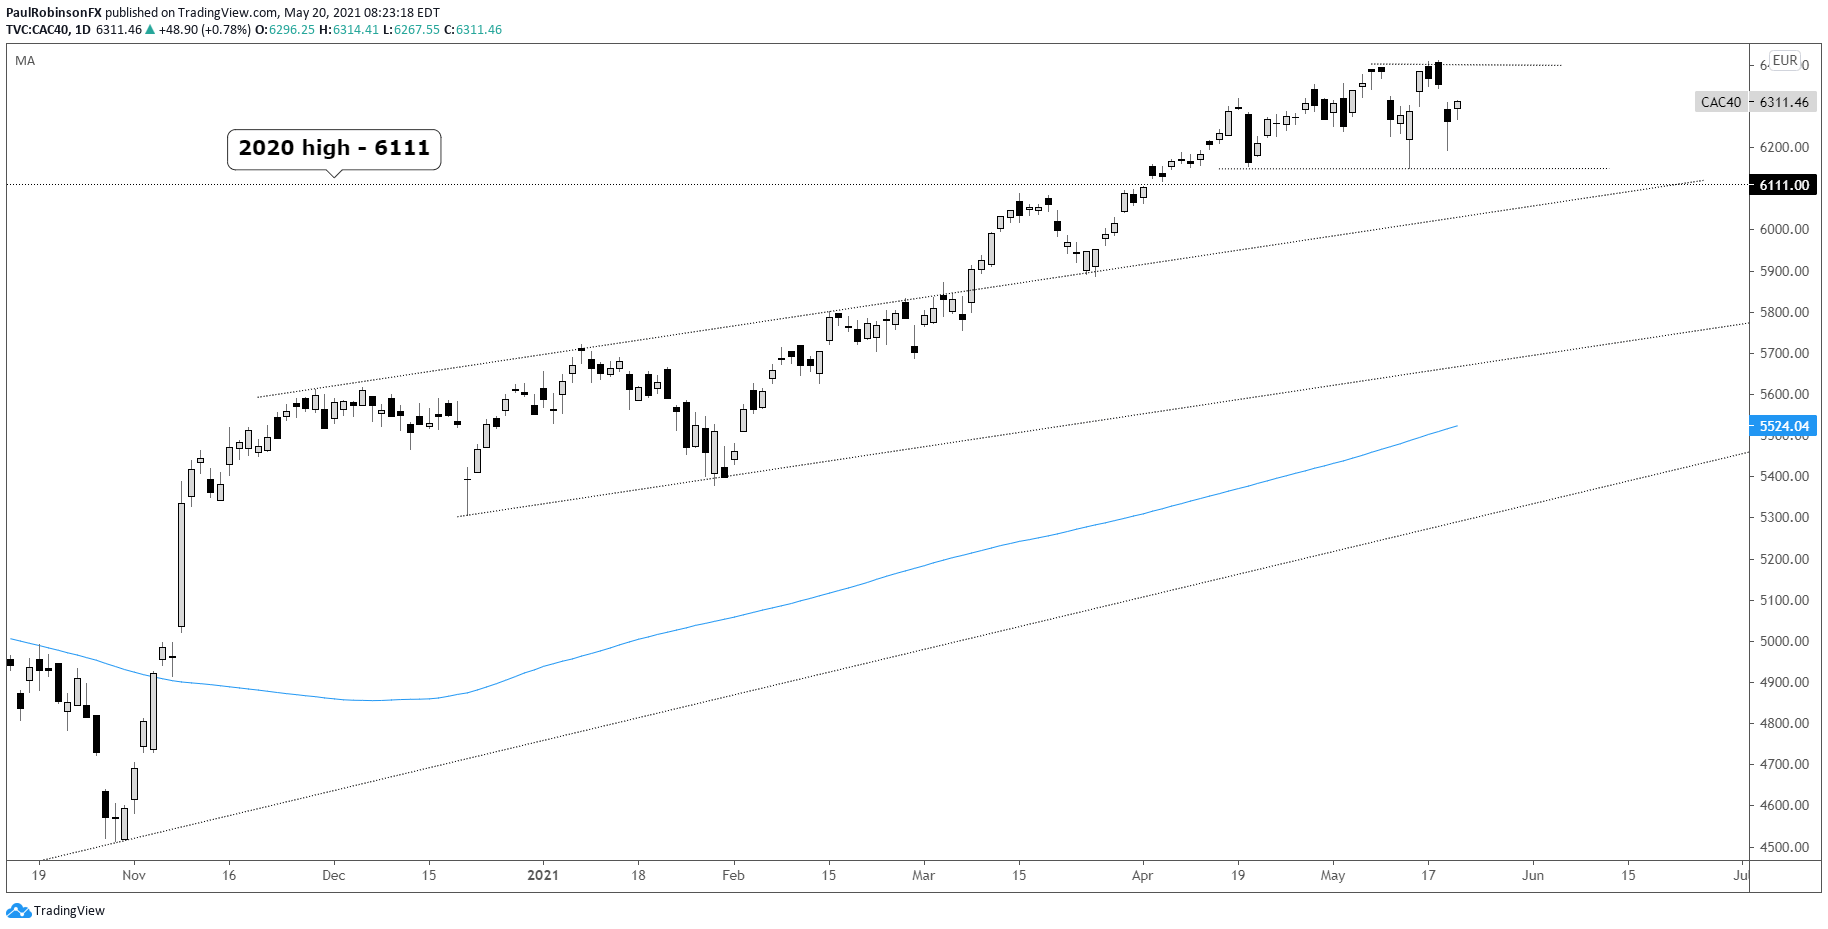
The CAC 40 is trading in a less defined range, but has a couple of levels on the top and bottom-side that are keeping it from moving. On the top-side, a breakout above 6412 needs to develop for a rally to continue. There isn’t substantial resistance until the 2000 record high at 6944, a level that is a sizable rally away but obtainable if global markets can continue to push higher.
On the downside, 6150 is becoming an increasingly important level to watch with two turns off of it. Just below there, should we see a breach, lies the 2020 high at 6111 and slope from November. With the market generally trending higher, we would want to see those levels breached in addition to 6150 before having a firm bias to the downside.
CAC Daily Chart (range forming)
Resources for Forex Traders
Whether you are a new or experienced trader, we have several resources available to help you; indicator for tracking trader sentiment, quarterly trading forecasts, analytical and educational webinars held daily, trading guides to help you improve trading performance, and one specifically for those who are new to forex.
---Written by Paul Robinson, Market Analyst
You can follow Paul on Twitter at @PaulRobinsonFX


