


DAX 30 / CAC 40 Technical Highlights
- DAX 30 still trying to fill the coronavirus gap
- CAC 40 much weaker, caught in choppy price action
DAX 30 still trying to fill the coronavirus gap
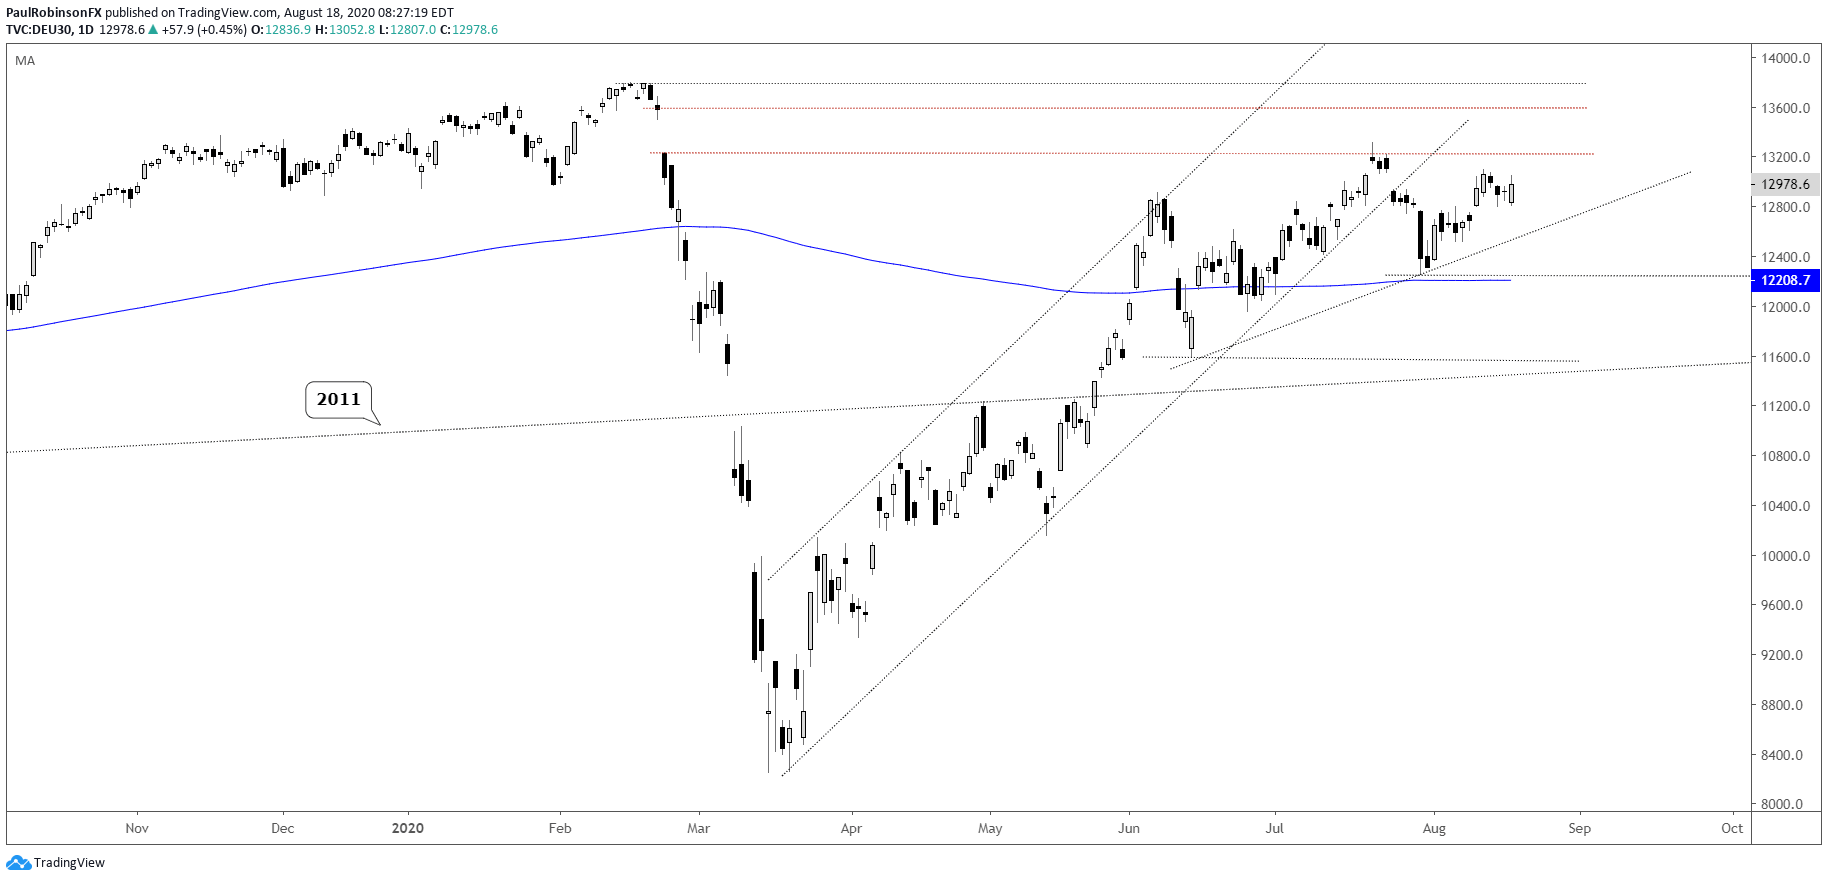
The DAX chart isn’t particularly pretty, but still has a modest (very modest) upward bias to it as it continue to try and fill the coronavirus gap from February 24. The turn down on July 21 shows the difficulty this gap presents, but it seems like at some point it will get filled as long as global markets (in the particular the U.S.) keeps a bid.
To fill the gap up to 13579, the DAX needs to trade on through 13313 first. A gap-fill will have the market very near the 13795 record high. On the flip-side, should the DAX remain sluggish and unable to rise into the gap, then we could see a move back towards the 200-day at 12208. It is relatively aligned with the July 30 low at 12253.
Overall, trading conditions aren’t ideal at the moment and in the absence of a significant catalyst we may continue to see slow price action until we move past August, traditionally a slow month for markets.

DAX Daily Chart (still stuck below coronavirus gap)
CAC 40 much weaker, caught in choppy price action
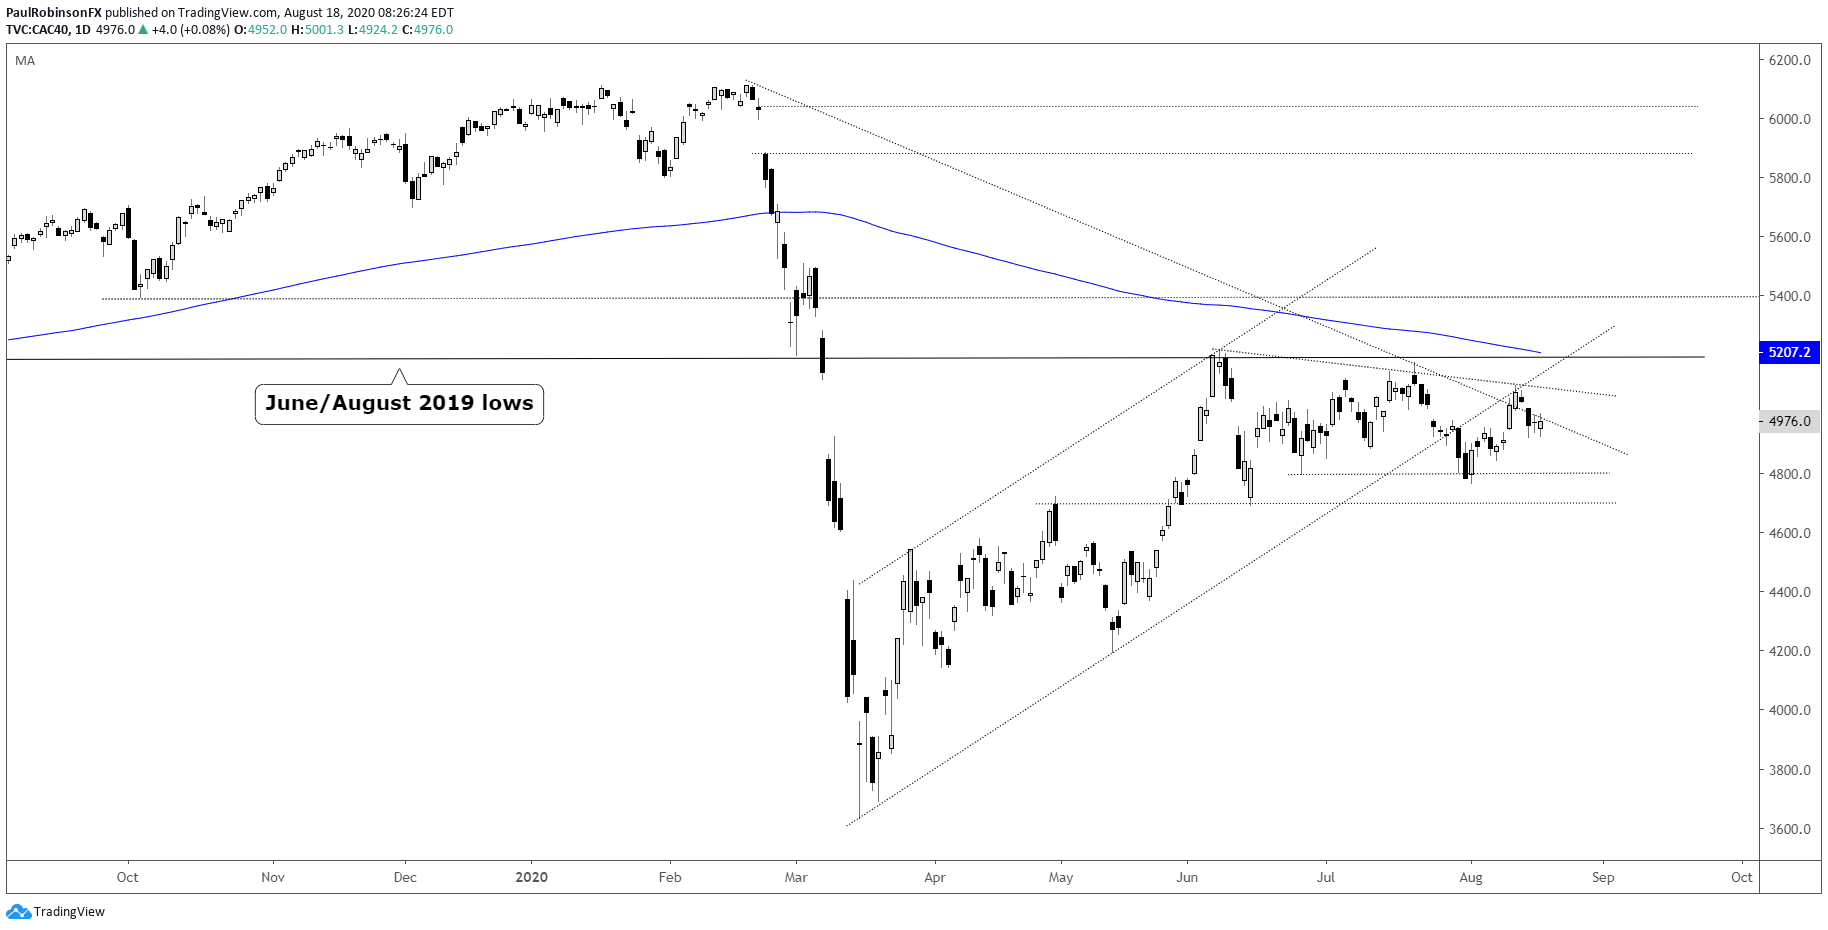
The CAC hasn’t gone anywhere since early June, trading sideways as it remains mired by resistance of several forms. The June/August 2019 lows were an issue in June and July of this year. There is also a trend-line running down from February that is in the way at the moment. In confluence with the summer highs is he 200-day MA, so a lot for the CAC to get through if it is to keep rising. On the downside there is support around 4800 should we see weakness from here. For now, standing aside until the picture clears up.

CAC 40 Daily Chart (stuck in a range)
Want to learn more about trading the DAX? Check out ‘How to Trade the DAX’, and join me weekly for technical updates in the Indices and Commodities webinar.
Forex Trader Resources
Whether you are a new or experienced trader, we have several resources available to help you; indicator for tracking trader sentiment, quarterly trading forecasts, analytical and educational webinars held daily, trading guides to help you improve trading performance, and one specifically for those who are new to forex.
---Written by Paul Robinson, Market Analyst
You can follow Paul on Twitter at @PaulRobinsonFX


