


DAX 30/CAC 40 Technical Highlights
- DAX off its recent highs, but only looking like a pullback so far
- CAC weakness bought parallel support into play, needs to hold
For fundamental and technical forecasts, trade ideas, and educational guides, check out the DailyFX Trading Guides page.
DAX off its recent highs, but only looking like a pullback so far
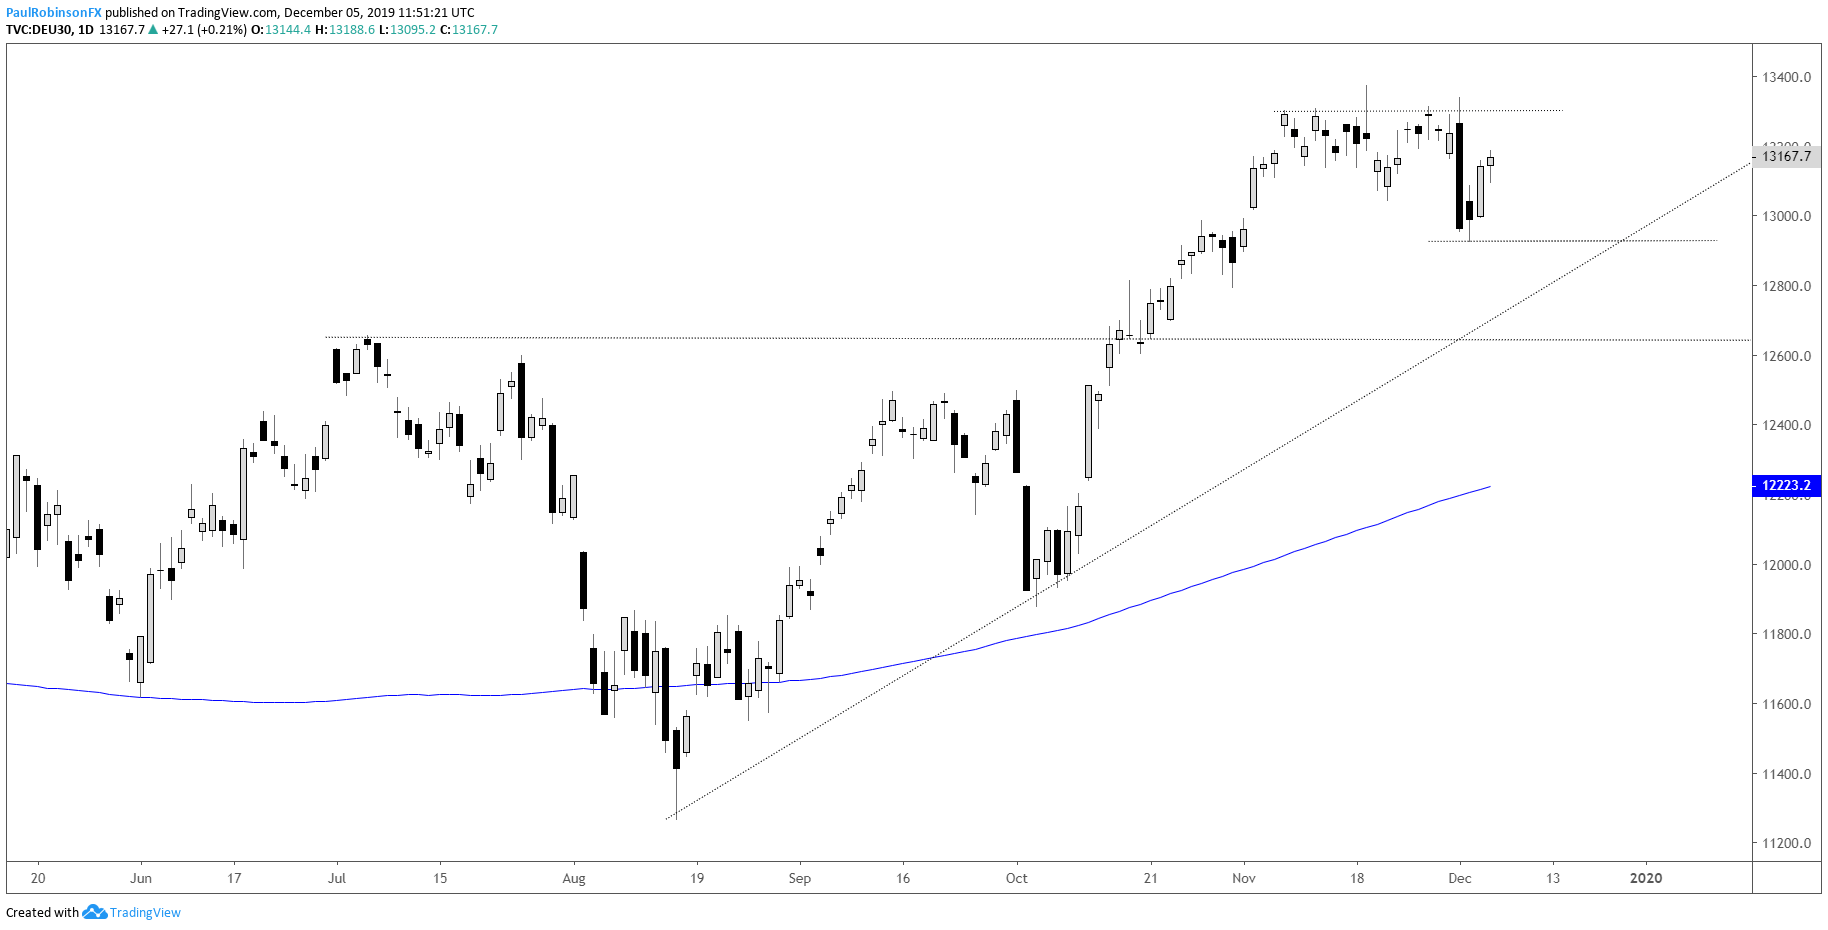
The DAX was hit quite aggressively on Monday after consolidating for the better part of November. This initially set up the market for some more downside, and may still, but the relatively strong snapback is keeping sellers at bay for now.
The willingness for buyers to step in so quickly is a positive for the market and could mean either a new leg higher is about to develop or a period of further consolidation is in store. Higher levels could still within reason see the market rally to and past the record high set at 13597 back in January 2018.
If we don’t see a further bullish response, keep an eye on this week’s low at 12927. A breakdown below there may not mean much more selling, however, before a low is in put in. The trend-line rising up from the August low could turn into a sturdy backdrop. It will require a break of that line before a larger sell-off can grow legs.
DAX 30 Daily Chart (only a pullback so far)
CAC weakness bought parallel support into play, needs to hold
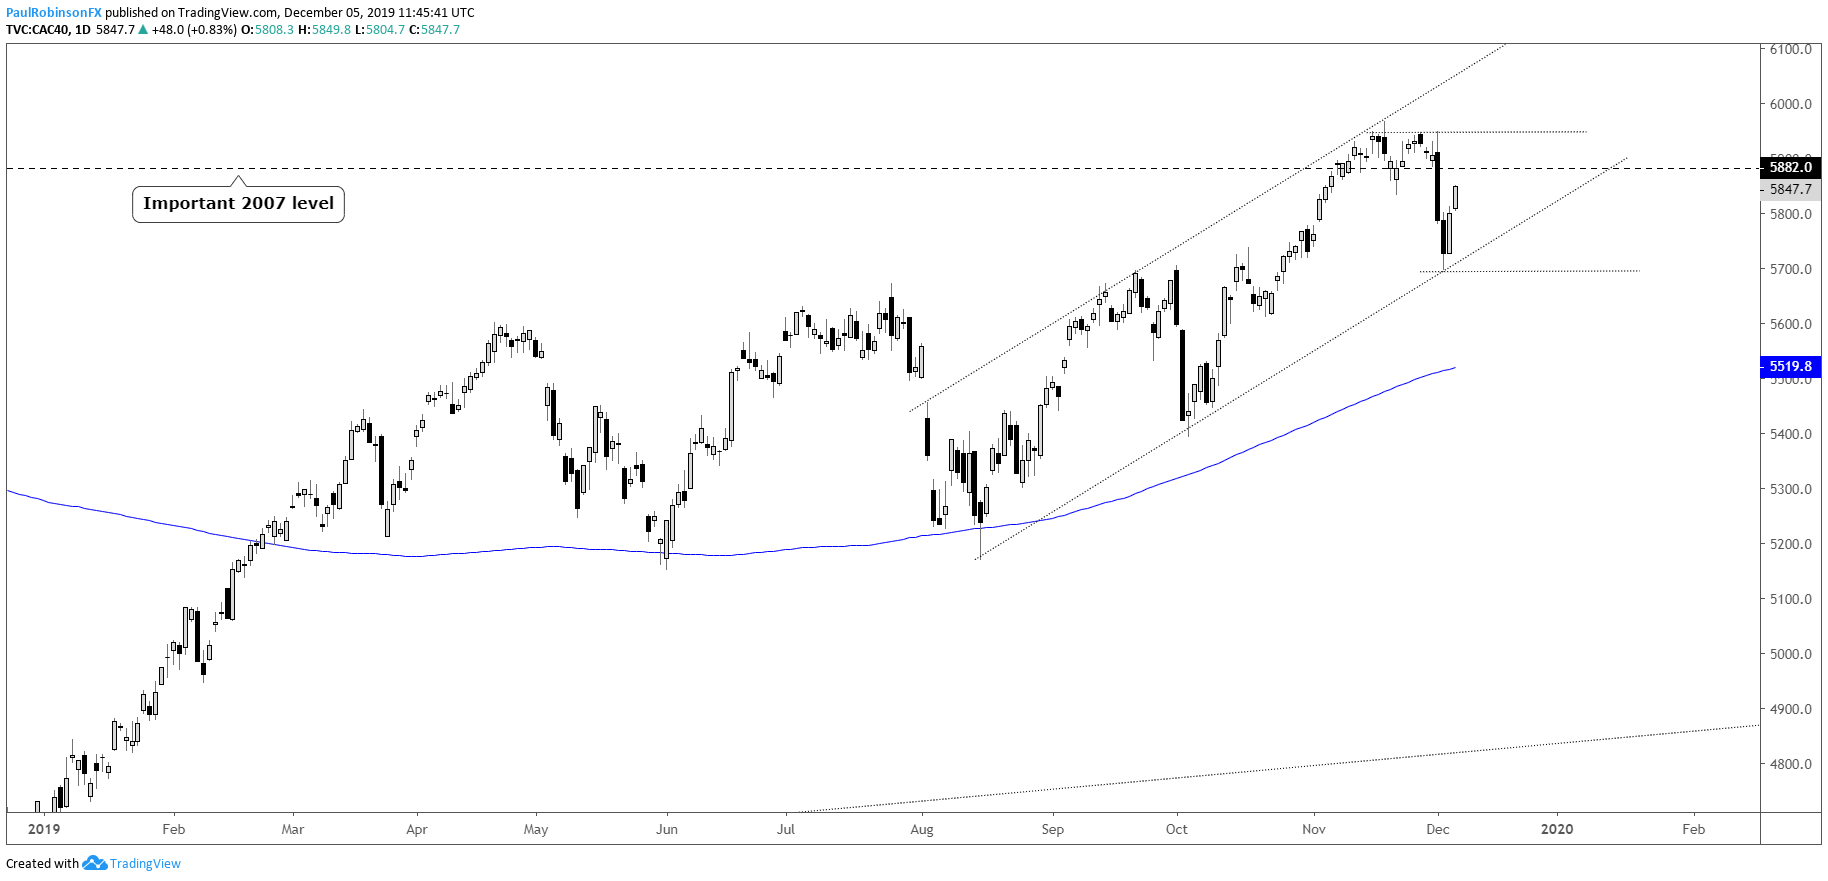
The CAC pullback came from around an important level from 2007 (major lower-high before 2008…), resulting in a firm test of the lower parallel running back to the August low. It’s a solid-looking channel structure, and as long as the CAC remains inside of it then the outlook is neutral to bullish.
Another push higher from here could see the psychological level of 6k tested in the not-too-distant future. But even if the French market is a bit sluggish, again, stay above the lower parallel and the outlook is for sideways price action at worst.
A decline below the line and the weekly low at 5697 would be reason to look for the pullback to deepen or worse, with a test of the 200-day then becoming an increasingly likely event.
CAC 40 Daily Chart (bouncing off lower parallel support)
Want to learn more about trading the DAX? Check out ‘How to Trade the DAX’, and join me weekly for technical updates in the Indices and Commodities webinar.
Forex & CFD Trader Resources
Whether you are a new or experienced trader, we have several resources available to help you; indicator for tracking trader sentiment, quarterly trading forecasts, analytical and educational webinars held daily, trading guides to help you improve trading performance, and one specifically for those who are new to forex.
---Written by Paul Robinson, Market Analyst
You can follow Paul on Twitter at @PaulRobinsonFX


