


DAX 30/CAC 40 Technical Highlights
- DAX extended into the year-high from July
- CAC hit a new multi-year high, but at resistance
For fundamental and technical forecasts, trade ideas, and educational guides, check out the DailyFX Trading Guides page.
DAX extended into the year-high from July
The recent surge in the DAX has the index above one key threshold of resistance by way of the trend-line off the January 2018 high. A line that gave the market trouble on three occasions in recent weeks. Yesterday’s move was enough to edge the market to its best levels of the year, but still can consider the July a spot to watch for potential weakness.
The rally since October 4 up to yesterday was one of the more impressive short-term surges we’ve seen in a long time. The DAX may be short-term overbought and in need of a digestion phase before running higher, but the strength of momentum suggests that higher prices could indeed be in store soon.
Looking at the peaks from September 12 to October 1 (all arriving at the Jan ’18 t-line), there should be some good support around the 12500/470-area. Just around that area, given its low angle, lies the 2018 trend-line.
On further strength, the underside of the December trend-line will be a targeted area of resistance, then followed by, and perhaps in confluence with the trend-line, a swing-high from July 2018 at 12886.
DAX 30 Daily Chart (looking to further itself along)

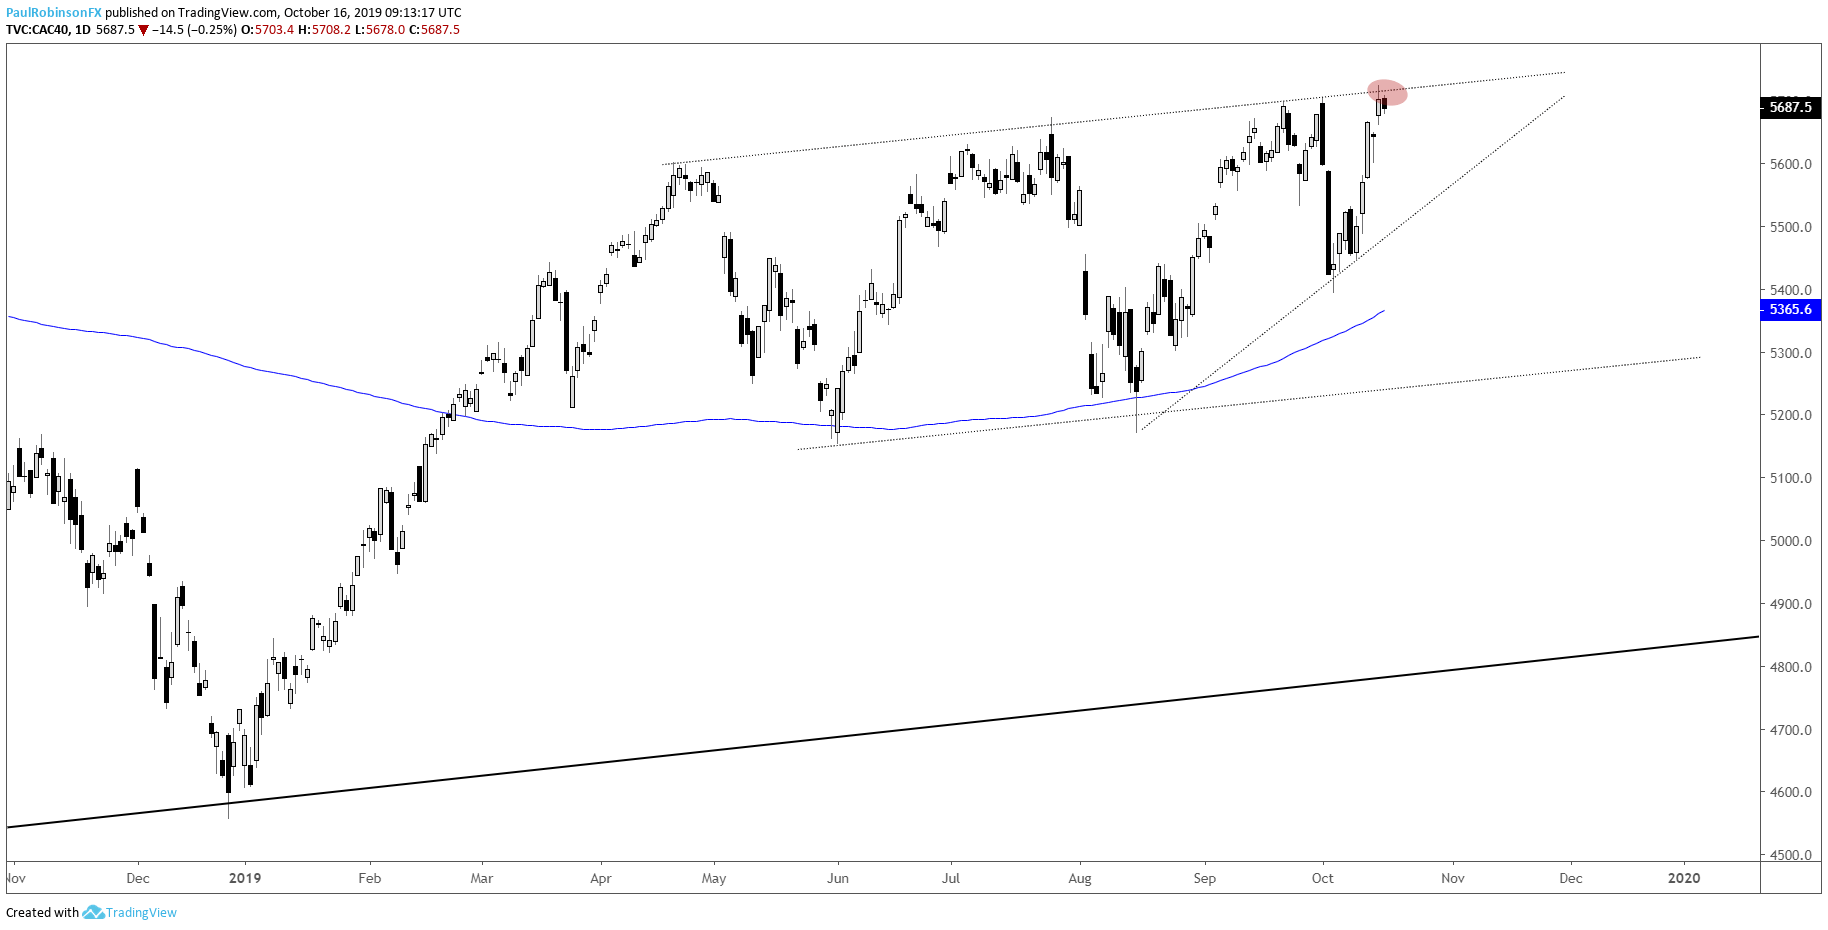
CAC hit a new multi-year high, but at resistance
The CAC hit new highs for the year yesterday, best levels since before the GFC. But it’s been here before only to fail. There is a trend-line running over across tops since April that are helping keep a lid on price. A cross of this resistance should have the French index rolling higher, but until it does it must be treated as resistance.
A consolidation, then breakout could provide a platform for fresh longs. In the event of higher prices, there isn’t anything until a swing high from late-2007 located at 5865. On a pullback, support comes in via a minor trend-line off the August low.
CAC 40 Daily Chart (trading at trend-line resistance)
Want to learn more about trading the DAX? Check out ‘How to Trade the DAX’, and join me weekly for technical updates in the Indices and Commodities webinar.
Forex & CFD Trader Resources
Whether you are a new or experienced trader, we have several resources available to help you; indicator for tracking trader sentiment, quarterly trading forecasts, analytical and educational webinars held daily, trading guides to help you improve trading performance, and one specifically for those who are new to forex.
---Written by Paul Robinson, Market Analyst
You can follow Paul on Twitter at @PaulRobinsonFX


