


DAX 30/CAC 40 Technical Highlights
For fundamental and technical forecasts, trade ideas, and educational guides, check out the DailyFX Trading Guides page.
DAX momentum turning down from trend-line
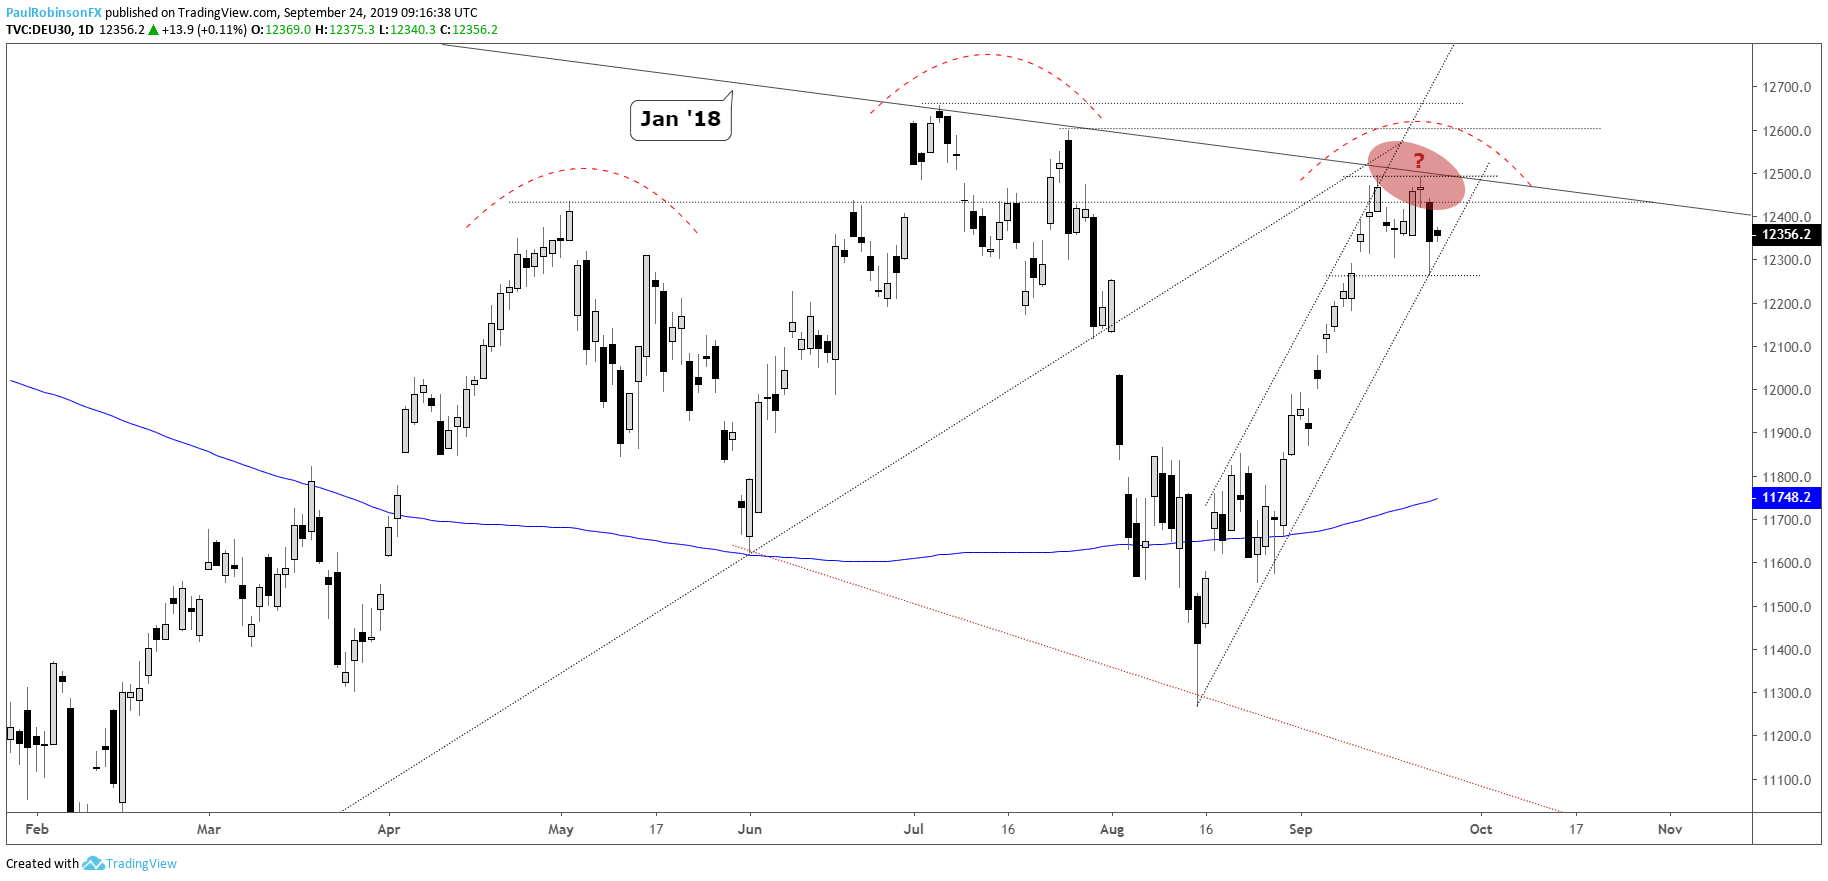
The DAX came very near resistance back on Sep 13, but from there the price action wasn’t convincing in terms of rejecting resistance to give sellers the upper hand. On the flip-side, with price up against resistance despite no turn down in momentum, the index doesn’t offer good risk/reward on new long positions.
That could be changing. Yesterday wasn’t an ultra-reversal lower or anything, but after another failed attempt to break above the trend-line from Jan 2018, it may be enough to tilt the field in favor of sellers soon.
Yesterday, the Sep 11 gap was filled by a few points, which makes 12264 a solid area of near-term support. A break below should continue to see the market lower, while a break above 12494 and the Jan ’18 trend-line will have the DAX positioned to challenge the year highs.
The big-picture head-and-shoulders (H&S) pattern is still a distinct possibility if the market can roll over from here. It’s got a good way to go before reaching breaking the neckline (confirmation), so for now it is only a scenario…
DAX 30 Daily Chart (trying to turn lower)
CAC breakout at risk of a meaningful failure
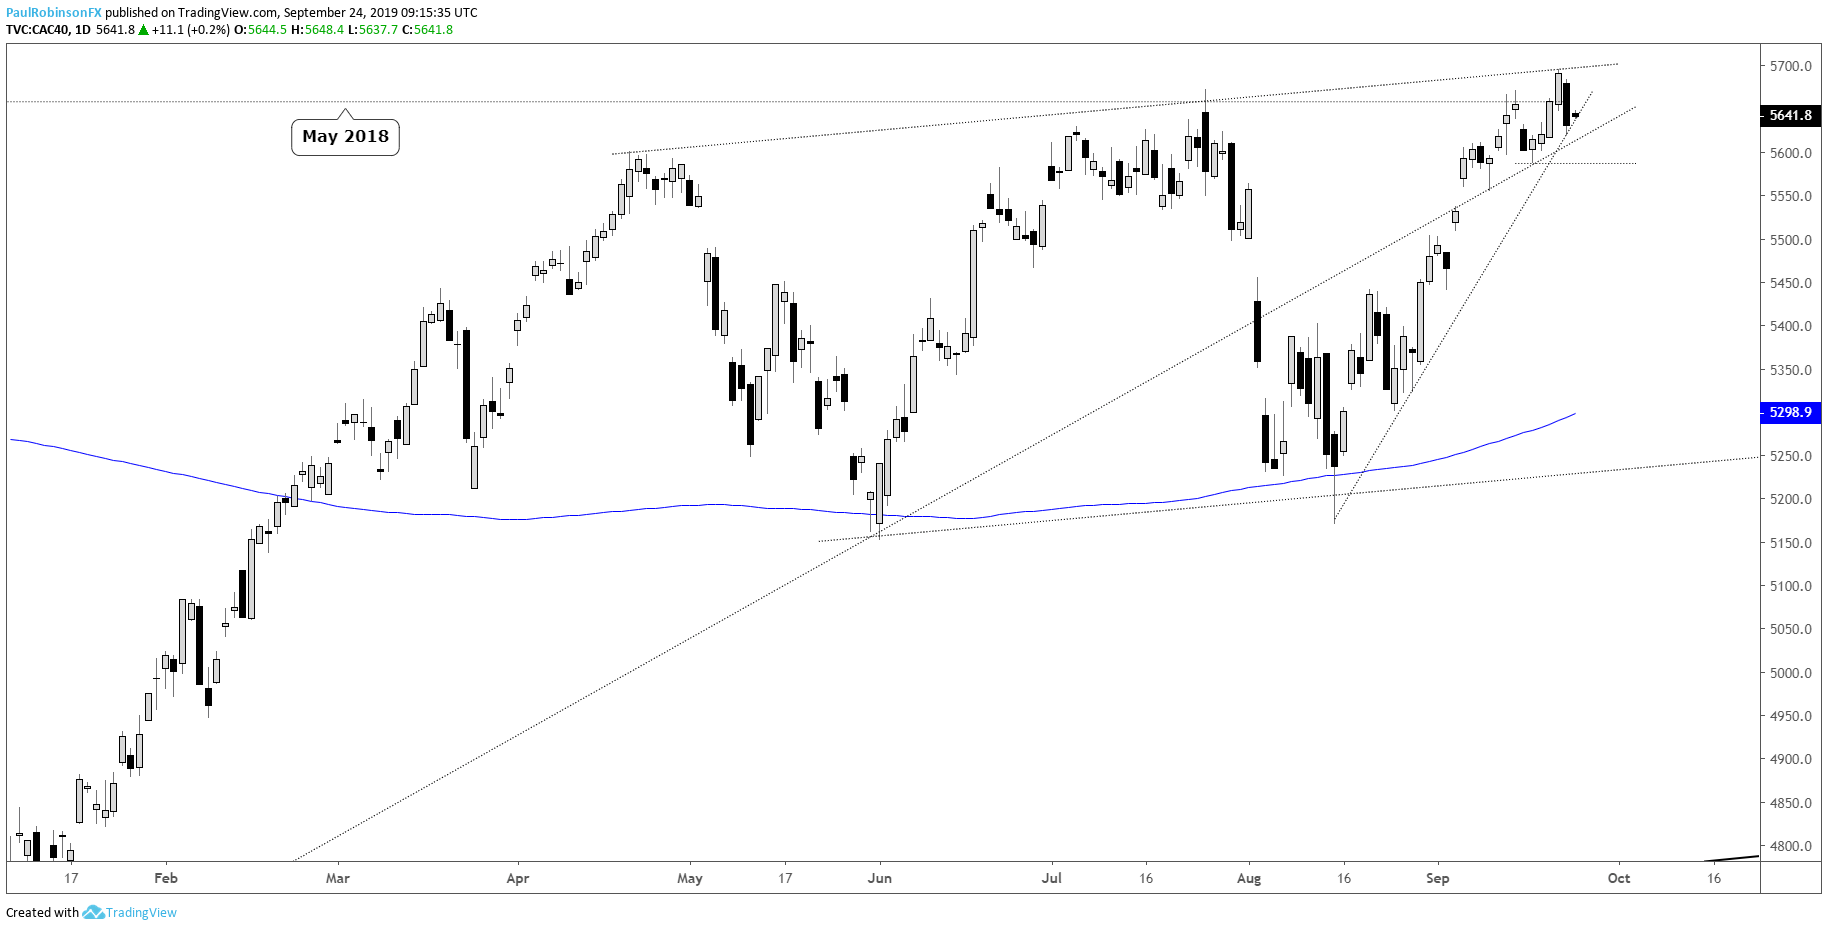
On Friday, the CAC closed to fresh multi-year highs, levels not seen since 2007. The crossover above the July high and May 2018 peak is failing at this time, with yesterday’s decline coming from a minor trend-line dating back to April. If the fake-out breakout isn’t quickly erased it could become a meaningful event.
Watch the trend-line rising up from the August low and slope from the December bottom, they cross through around the same area. A decline through 5587, the Sep 17 low, will have the market below support. A reclaiming of the breakout needs to happen quickly, and if it does then we must respect the upward trend.
CAC 40 Daily Chart (fake-out breakout?)
Want to learn more about trading the DAX? Check out ‘How to Trade the DAX’, and join me weekly for technical updates in the Indices and Commodities webinar.
Forex & CFD Trader Resources
Whether you are a new or experienced trader, we have several resources available to help you; indicator for tracking trader sentiment, quarterly trading forecasts, analytical and educational webinars held daily, trading guides to help you improve trading performance, and one specifically for those who are new to forex.
---Written by Paul Robinson, Market Analyst
You can follow Paul on Twitter at @PaulRobinsonFX


