DAX 30/CAC 40 Technical Highlights
For fundamental and technical forecasts, trade ideas, and educational guides, check out the DailyFX Trading Guides page.
DAX at a crossroads of resistance lines
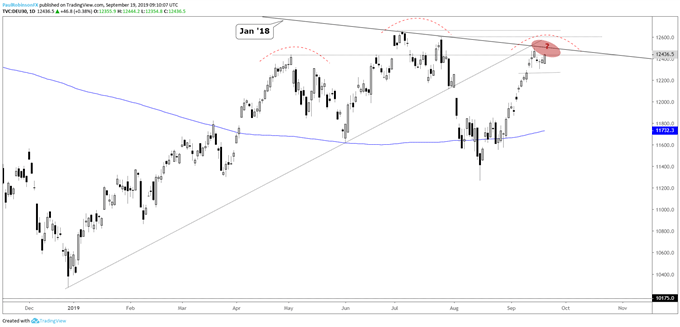
The DAX rally starting in August stalled last week very near the trend-line running down from the 2018 high. It led to a shallow pullback, but was unconvincing and thus not surprising to see another push higher today.
The attempt to rally here could be thwarted again, but this time in a more meaningful way as a thorough test of trend resistance and the May high come into play. A through test and rejection will be considered a warning sign for longs, positive sign for would-be shorts.
If weakness does indeed soon come, then look for the September 11 gap down to 12268 to get filled and as the first level of potential support. From there nothing meaningful to note for a good way down. A sharp enough turn down could mark the right shoulder of a large head-and-shoulders pattern. The pattern still has a lot of work to do before becoming validated on a neckline break, but one worth watching.
Should resistance fail to put in a peak, then watch the zone from 12600 up to 12656, peaks created during July. Additionally, the underside of the trend-line from December runs up through the vicinity.
DAX 30 Daily Chart (resistance)

CAC in a face-off with multi-year highs
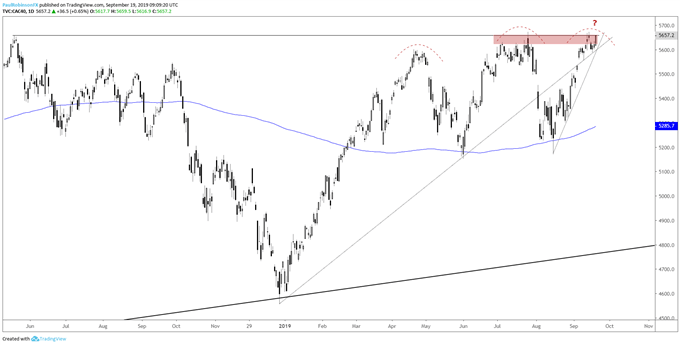
The CAC is very near pushing to new multi-year highs as the peak from July and May of last year come under assault. A close above 5673 will have a new intra-day and closing high in place. This will get the CAC into open space and positioned for higher prices.
However, a rejection here could mark a third and final push higher from the December low and carve out a topping pattern similar to the DAX, but not technically an H&S formation. More of a double top that is nearly a triple top.
CAC 40 Daily Chart (July/2018 high)

Want to learn more about trading the DAX? Check out ‘How to Trade the DAX’, and join me weekly for technical updates in the Indices and Commodities webinar.
Forex & CFD Trader Resources
Whether you are a new or experienced trader, we have several resources available to help you; indicator for tracking trader sentiment, quarterly trading forecasts, analytical and educational webinars held daily, trading guides to help you improve trading performance, and one specifically for those who are new to forex.
---Written by Paul Robinson, Market Analyst
You can follow Paul on Twitter at @PaulRobinsonFX


