


DAX 30/CAC 40 Technical Highlights
For fundamental and technical forecasts, trade ideas, and educational guides, check out the DailyFX Trading Guides page.
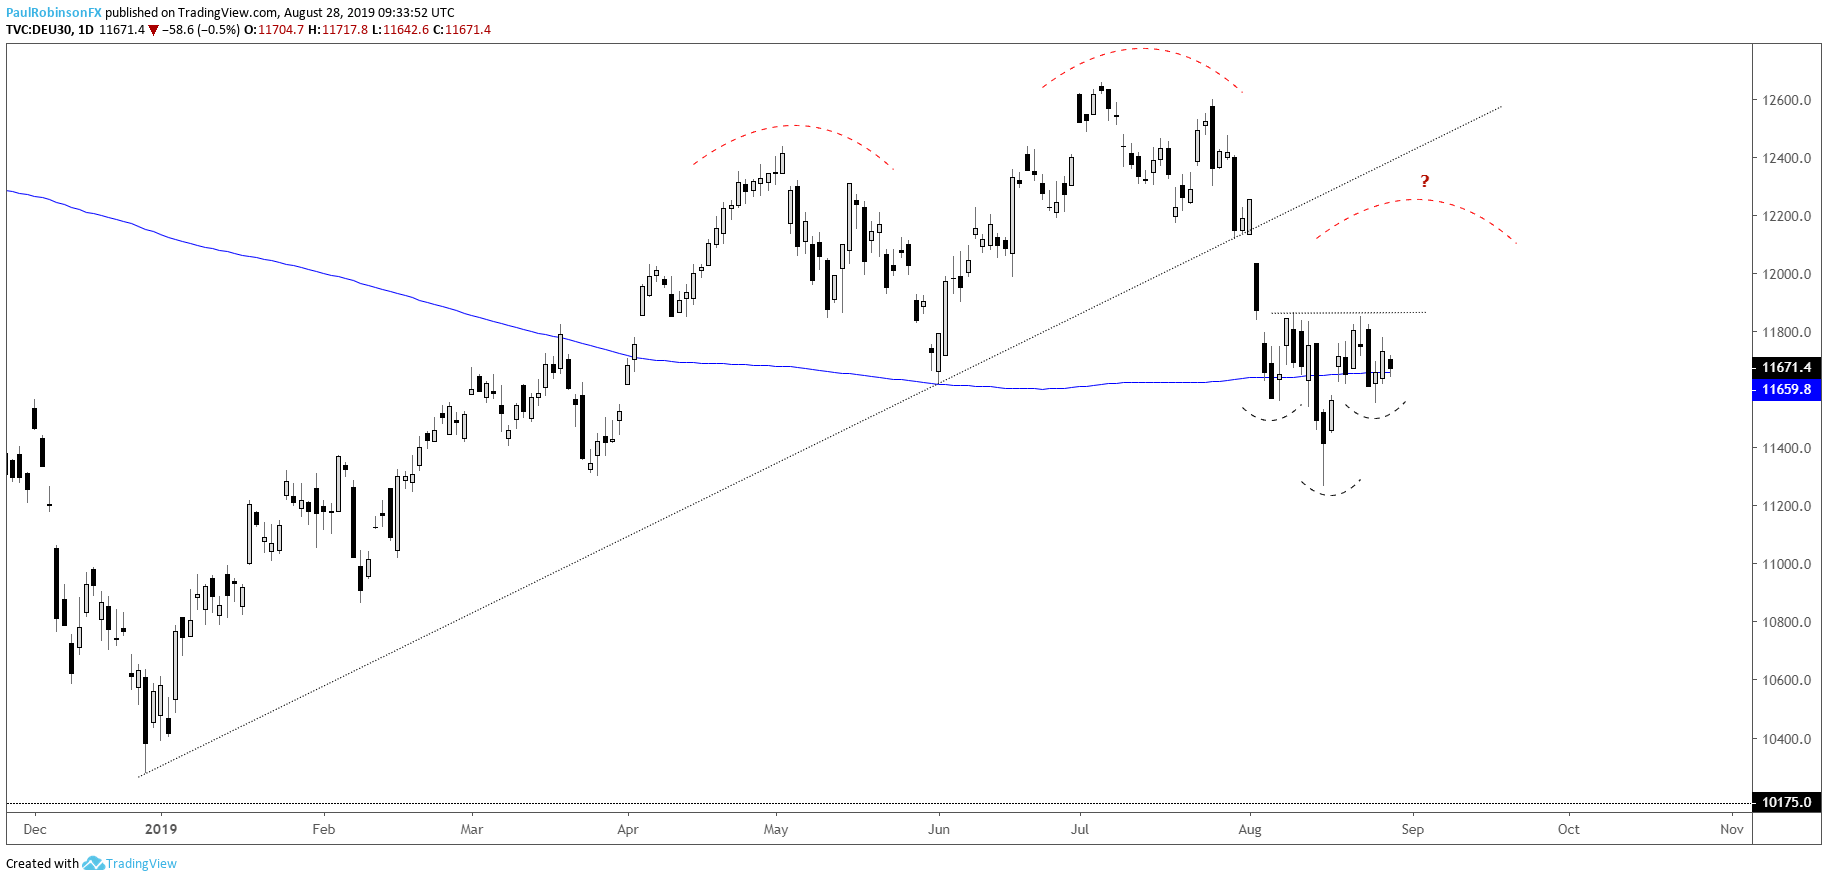
DAX trying to bottom out for now
In the short-term, the DAX 30 has been trying to build a base via an inverse head-and-shoulders pattern forming around the 200-day MA. It may get the market moving towards higher levels if the neckline triggers beyond the 11865-mark.
A rally out of the inverse H&S is seen as potentially having levels from just over 12k up to the gap-fill from August 1 at 12253 in focus. Even if this is the case, though, it won’t do a lot of good for getting the index bullishly postured longer-term.
In fact, all it may do is get the DAX closer to its next downturn if the larger, traditional H&S pattern comes to fruition with the right shoulder then forming following a near-term rally. This is only a scenario at this time, but one worth monitoring should near-term forces continue to push the market higher.
If the DAX can’t get into gear here soon, then you could still have a head-and-shoulders pattern trigger with a weak right shoulder resulting from the recent display of weak upward price action. A drop below 11266 is seen as spurring along momentum.
DAX 30 Daily Chart (inverse H&S inside H&S)
CAC stronger, but not by much
The CAC has been slightly stronger than the DAX, which has been the case on several occasions in recent history. Higher prices from here will have the December trend-line and August 1 gap-fill at 5557 in play as resistance; this could put the capper on the right shoulder of an H&S pattern. A corrective wedge could be in the works as well with a little more time, the anticipated result being lower prices.
CAC 40 Daily Chart (grinding towards Dec t-line)

Want to learn more about trading the DAX? Check out ‘How to Trade the DAX’, and join me weekly for technical updates in the Indices and Commodities webinar.
Forex & CFD Trader Resources
Whether you are a new or experienced trader, we have several resources available to help you; indicator for tracking trader sentiment, quarterly trading forecasts, analytical and educational webinars held daily, trading guides to help you improve trading performance, and one specifically for those who are new to forex.
---Written by Paul Robinson, Market Analyst
You can follow Paul on Twitter at @PaulRobinsonFX


