


DAX 30/CAC 40 Technical Highlights
- DAX pulling back, healthy or a sign when compared to the U.S.?
- CAC healthier looking, lots of resistance to contend with though
For fundamental and technical forecasts, trade ideas, and educational guides, check out the DailyFX Trading Guides page.
DAX pulling back, healthy or a sign when compared to the U.S.?
The DAX 30 weakening this month so far hasn’t been too alarming, as it has unfolded with relatively weak momentum. But when compared to the world’s largest market, the U.S., German stocks have been showing signs of relative weakness. It might not be anything to worry about, but a development worth monitoring moving forward should we continue to see a growing divergence between Europe and the U.S.
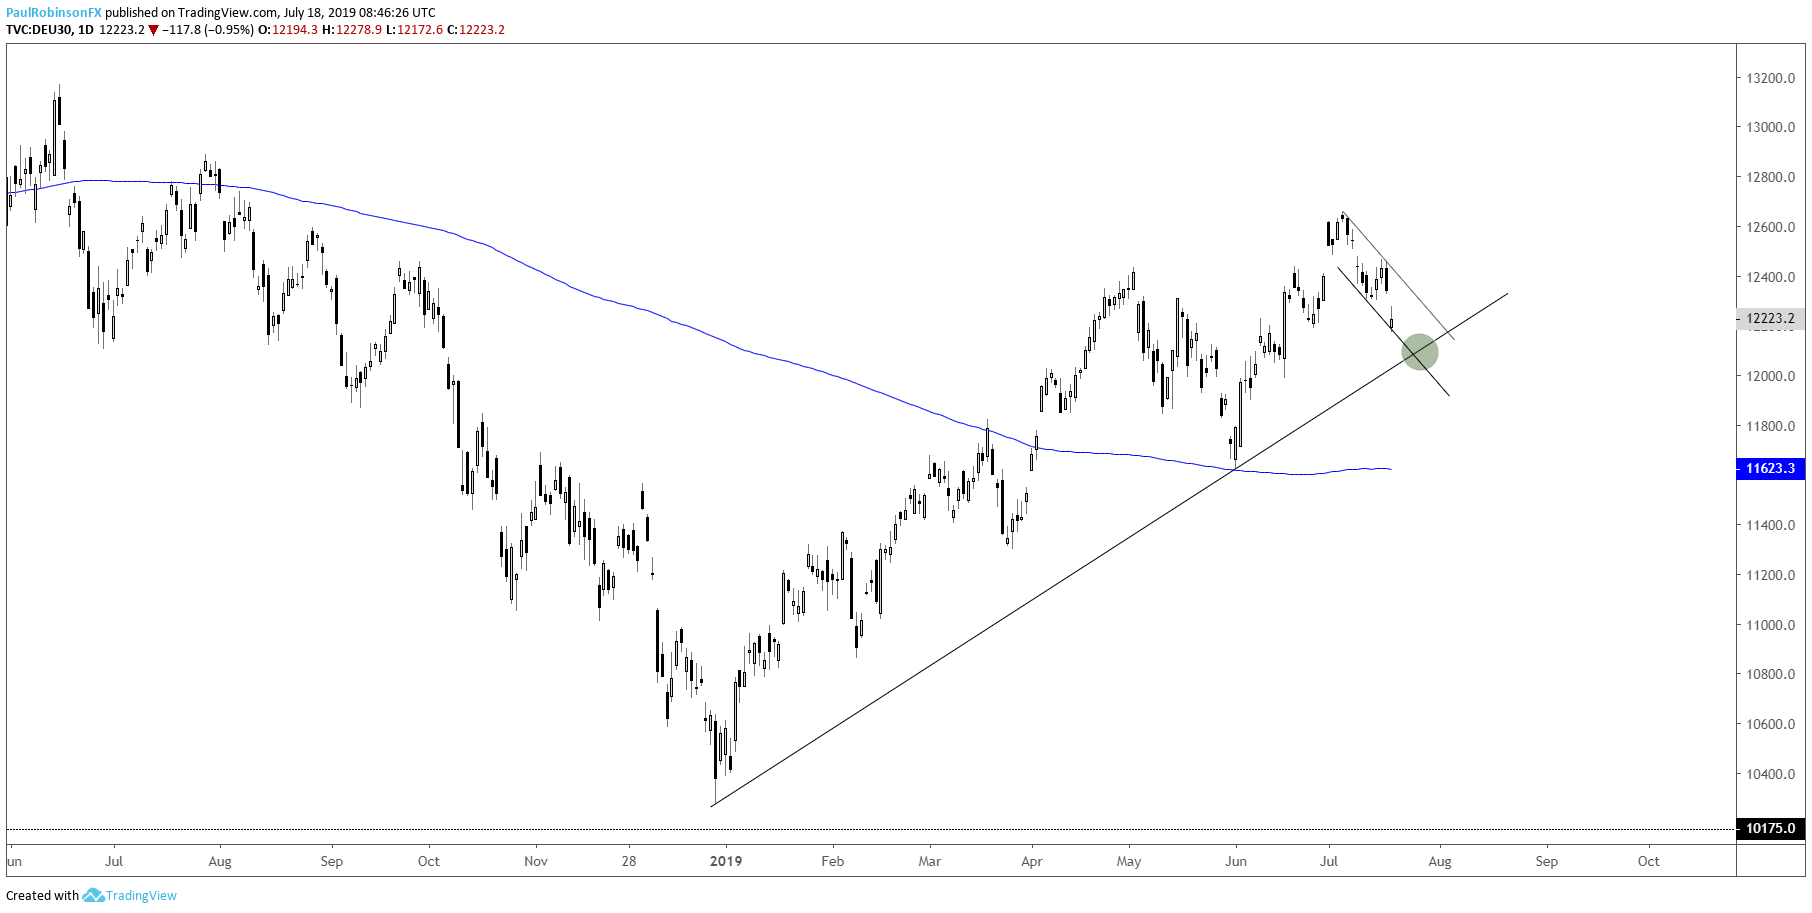
Looking at the DAX chart alone, it still looks like a heathy pullback and has trend support to test not far below. A test of the trend-line off the December low could help further support the uptrend dating back to the late-year low. It could also offer would-be longs a solid risk/reward spot to enter.
It’s possible that with a little more time the developing channel off the July 4 high will present a bull-flag-like pattern to operate with as well. Holding the December trend-line and then breaking the top-side of the channel would make for an appealing set-up from where I sit – Hold support, then break resistance.
DAX 30 Daily Chart (pulling back to t-line)
CAC healthier looking, lots of resistance to contend with though
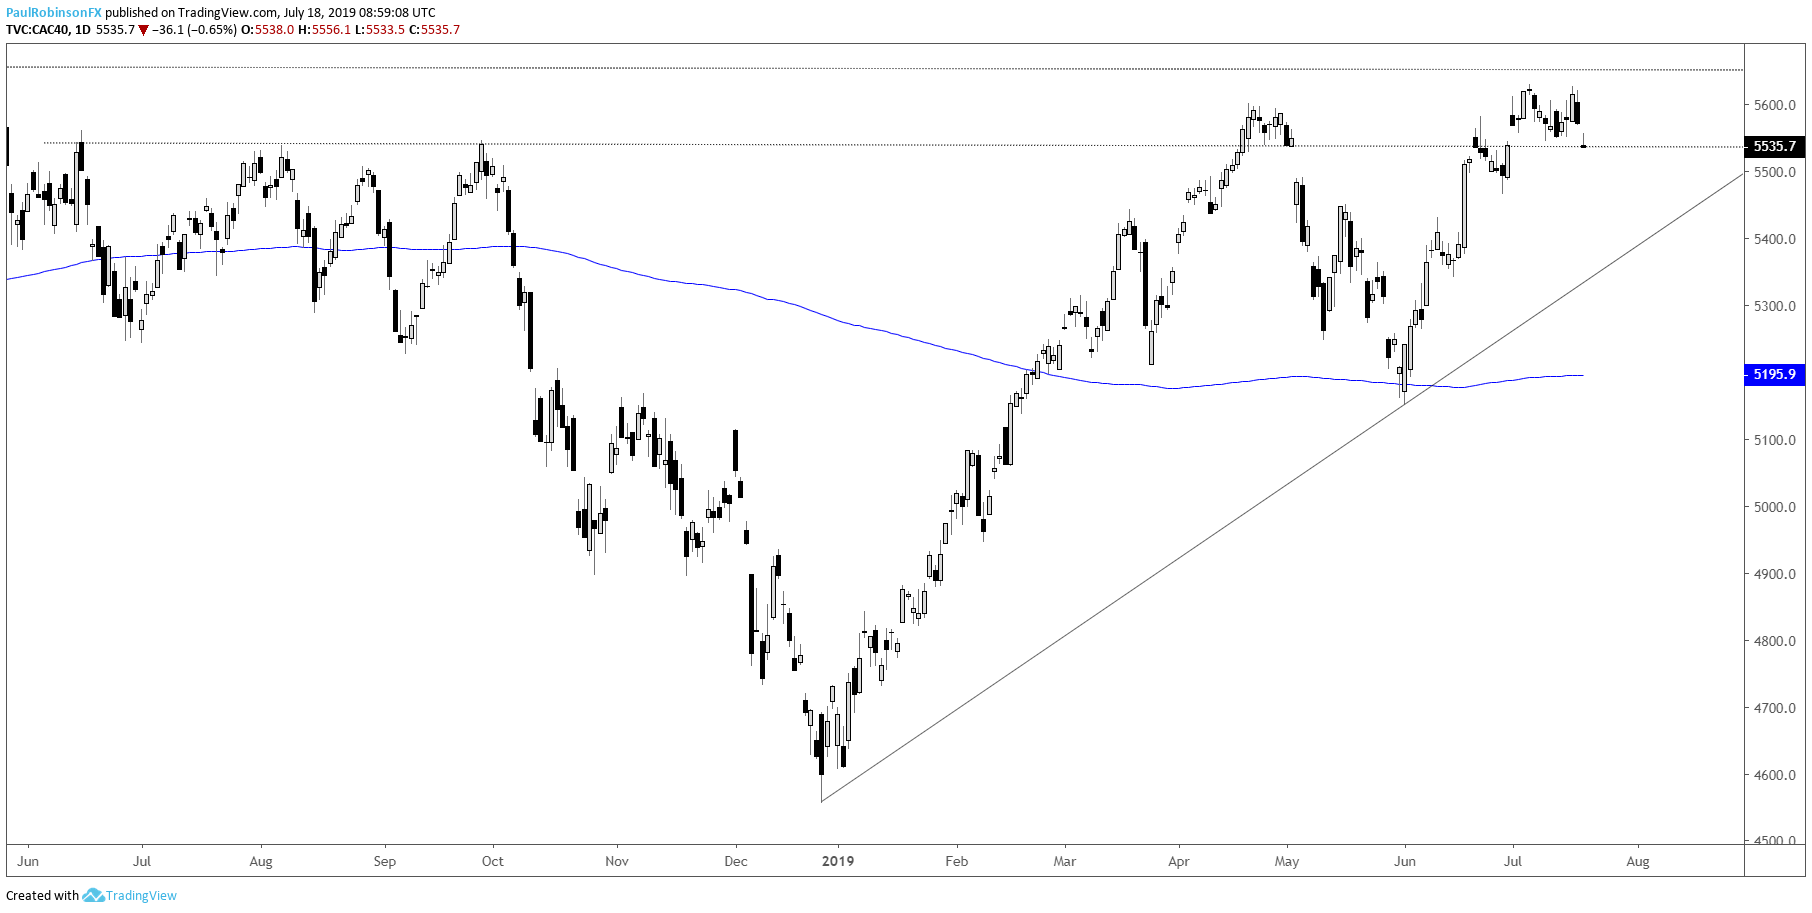
The CAC snuck above the April peak to test the May 2018 highs, but has so far struggled to maintain or climb above these critical swing highs. The recent price action for the French benchmark has been a bit more encouraging that is has for the DAX, with it moving mostly horizontal this month.
If the DAX tests the December trend-line, the CAC may not do-so as it is showing more strength. The only caveat to the CAC outperforming is that it may get tripped up on an attempt to break above the May 2018 high at 5657.
CAC 40 Daily Chart (holding up, but has lots or resistance ahead)
Want to learn more about trading the DAX? Check out ‘How to Trade the DAX’, and join me weekly for technical updates in the Indices and Commodities webinar.
Forex & CFD Trader Resources
Whether you are a new or experienced trader, we have several resources available to help you; indicator for tracking trader sentiment, quarterly trading forecasts, analytical and educational webinars held daily, trading guides to help you improve trading performance, and one specifically for those who are new to forex.
---Written by Paul Robinson, Market Analyst
You can follow Paul on Twitter at @PaulRobinsonFX


