DAX 30/CAC 40 Technical Highlights
- DAX over trend-line resistance but price action weakening
- CAC looks headed for a test of trend-line off December low
Fresh quarterly forecasts are out, to see where our team of analysts see the Euro, DAX, and other markets are headed in the coming weeks, check out the DailyFX Q2 Trading Forecasts.
DAX over trend-line resistance but price action weakening
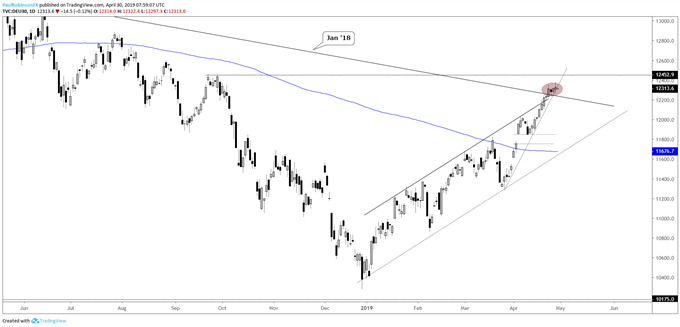
Last week, the discussion was aimed towards the notion that extended prices favored a pullback soon. And despite having crossed over the trend-line off the record high the bias is still shaping up to favor a pullback, or at least shift risk far enough towards a pullback that it puts longs in a tenuous position.
Momentum has slowed to a crawl without any retracement, so if it is to happen is should do so very shortly here. If not, then one more push may take it up to a swing-high from September around the 12450-mark before putting in a trade-able ceiling for the DAX.
All-in-all, risk is that weakness this week looks to be in the cards. A drop below the trend-line off the 2018 high is anticipated. How any decline unfolds (strong or weak selling) will dictate whether to turn aggressive on short-term shorts or use it as a possible ‘dip-trip’ set-up for longs.
DAX Daily Chart (stalling, could fall back below t-line)

CAC looks headed for a test of trend-line off December low
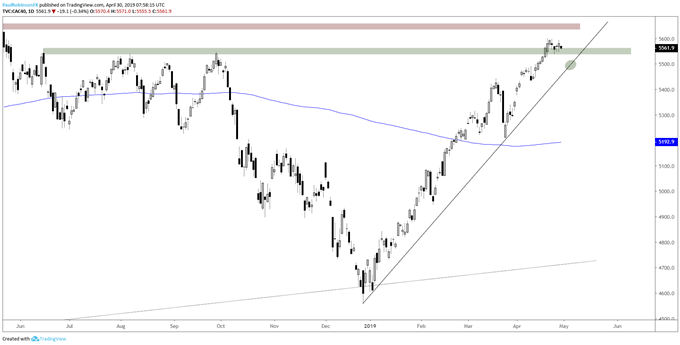
The CAC like the DAX is of course acting similarly. It is currently shelving itself on a support area formed by several peaks from last year, but a drop through 5538 should help accelerate downward momentum in the short-term.
This would then bring into play a test of the sharply angled trend-line off the December low and a pivotal spot for the market to either turn back higher from or fail and bring in more sellers.
CAC Daily Chart (watching for test of December t-line)

Want to learn more about trading the DAX? Check out ‘How to Trade the DAX’, and join me weekly for technical updates in the Indices and Commodities webinar.
Forex & CFD Trader Resources
Whether you are a new or experienced trader, we have several resources available to help you; indicator for tracking trader sentiment, quarterly trading forecasts, analytical and educational webinars held daily, trading guides to help you improve trading performance, and one specifically for those who are new to forex.
---Written by Paul Robinson, Market Analyst
You can follow Paul on Twitter at @PaulRobinsonFX


