


DAX 30/CAC 40 Technical Highlights
- DAX turning down around 2011 t-line, undermines recent bullish price action
- CAC turns down from key zone, on verge of breaking bullish channel
To see our intermediate fundamental and technical outlook for the DAX & Euro, check out the DailyFX Q1 Forecasts.
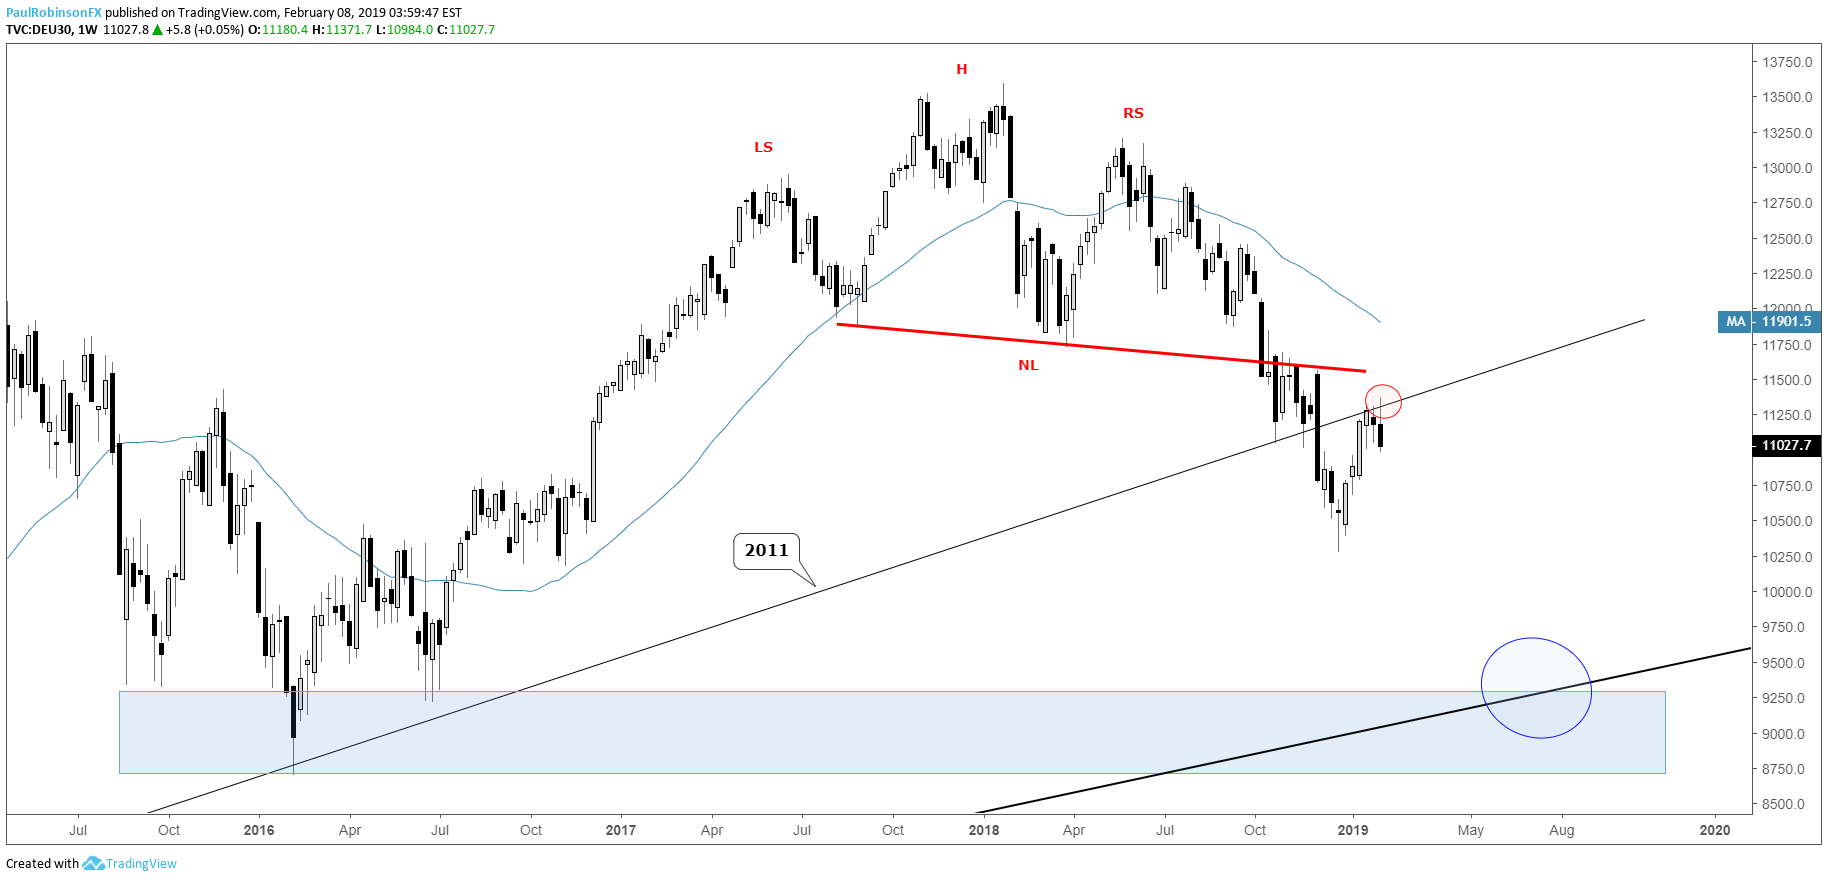
DAX turning down around 2011 t-line, undermines recent bullish price action
On a daily closing basis, the other day the DAX briefly rose above the 2011 trend-line as it was drawn in, but to be fair with it so long in duration there needs to be a buffer around it. With that said, this week’s pop and reverse is bringing into play a bearish weekly reversal off what was previously important support (old support, new resistance). A turn down here or not long from now will also be in-line with the continuation of the breakdown out of the long-term head-and-shoulders pattern.
Looking more near-term, on Tuesday the 1/25-2/4 range was broken convincingly to the top-side only to be fully undermined yesterday. This fake and reverse was enough to break the upward trajectory off the late-December low. This has focus shifted lower from a tactical standpoint and any small bounce from here will be viewed as a selling opportunity.
For market sentiment and to learn more about how to use it in your analysis, check out the IG Client Sentiment page.
DAX Weekly Chart (2011 t-line)
DAX Daily Chart (Pop and reverse shifts momentum down)

CAC turns down from key zone, on verge of breaking bullish channel
The CAC is finding big-picture opposition around lows created during the summer of 2017 and early-part of 2018. Barring a big take-back of yesterday’s sell-off then a small bearish weekly reversal bar will form. Looking at the shorter-term, the channel off the December low is coming under fire.
A break of the lower parallel (and top of the Oct t-line) should help usher in more selling. Though the indices are obviously correlated, the DAX is positioned more precariously than the its French counterpart, making it the preferred short.
CAC Weekly Chart (Big-picture resistance)

CAC Daily Chart (Channel Support at risk of breaking)

Want to learn more about trading the DAX? Check out ‘How to Trade the DAX’, and join me weekly for technical updates in the Indices and Commodities webinar.
Forex & CFD Trader Resources
Whether you are a new or experienced trader, we have several resources available to help you; indicator for tracking trader sentiment, quarterly trading forecasts, analytical and educational webinars held daily, trading guides to help you improve trading performance, and one specifically for those who are new to forex.
---Written by Paul Robinson, Market Analyst
You can follow Paul on Twitter at @PaulRobinsonFX


