


DAX/CAC Highlights:
- DAX gapped to a new record high this morning
- But there is resistance just ahead by way of a top-side trend-line
- CAC also in breakout territory, but has a pair of lines to overcome
For longer-term fundamental and technical analysis on the DAX, CAC, and other major markets, see the Q1 Trading Forecasts.
In recent sessions, the DAX found life once the euro took a breather after its breakout to 3-year highs. It was a scenario we painted last week, and thus far is playing out – but will the breakout last? The market is strong, of course, but there is reason for caution right on the horizon.
Despite having broken out into uncharted territory, there is an obstacle in the way not too far ahead. The top-side trend-line extending over from 2015 could be problematic. Overhead trend-lines in a strong market aren’t often major hurdles, but can sometimes have a surprisingly strong influence.
With that said, we’ll want to pay attention to how price action unfolds around this line of resistance, currently in the area of 13625. Should we see pressure exerted, the first levels of support clock in at the prior high of 13525, the gap-fill at 13463, and 13425.
Check out this guide for ideas on Building Confidence in Trading
Chart 1 – DAX: Daily

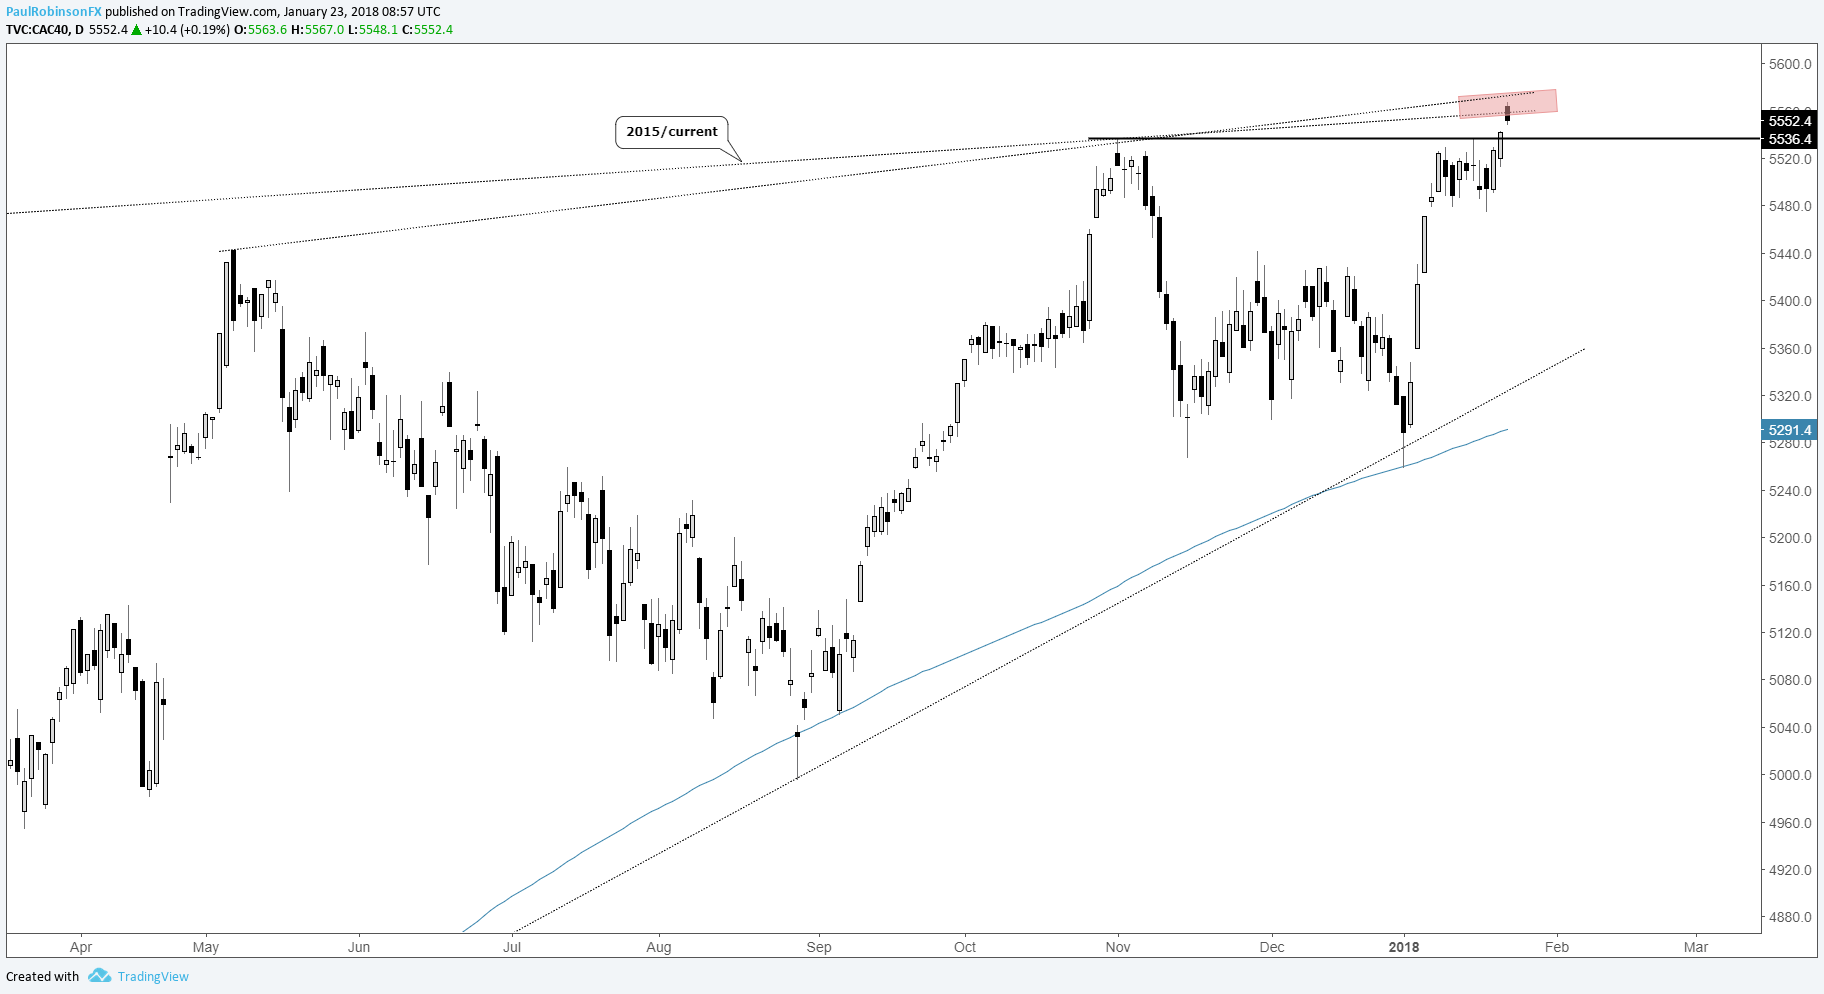
The CAC is in the same boat in terms of breaking out above the November high and then finding top-side trend-line resistance, but with a pair of them crossing over instead of just one. The first is the same 2015-current line which the DAX has to contend with, and the second is from May. The breakout high at 5536 is seen as the first level of support.
Chart 2 – CAC: Daily
---Written by Paul Robinson, Market Analyst
To receive Paul’s analysis directly via email, please SIGN UP HERE
You can follow Paul on Twitter at @PaulRobinsonFX


