British Pound, GBP, GBP/USD, GBP/JPY Talking Points:
- GBP/USD has continued to jump and is now trading at fresh two-month-highs following the earlier-week breakout from the bull flag formation.
- GBP/JPY has been a bit more subdued of late, but the pair posed a related breach of a falling wedge formation that’s since held below the prior highs.
- The analysis contained in article relies on price action and chart formations. To learn more about price action or chart patterns, check out our DailyFX Education section.


The British Pound continues to run higher and the currency is now one of the strongest in the world. This is a stark change-of-pace from just a month ago, when GBP was one of the weaker currencies available to FX traders.
There were high hopes for a rate hike in November from the Bank of England. At the time, GBP/USD was rubbing up against a confluent spot on the chart, holding inside of a bearish channel that made for a bull flag formation. But, when the BoE didn’t hike, the bottom fell out of the pair and sellers went on the prowl as prices dropped by more than 650 pips in a little over a month.
In early-December, a big spot of confluent support began to come into play just below the 1.3200 level. There was a prior swing low at 1.3188 and a Fibonacci level at 1.3167. There was also the support side of that same bull flag formation that had held the highs a month earlier, and this time the formation was at risk of being invalidated. But, December brought a rate hike out of the BoE and the winds of change began to show, with buyers making a more pronounced push in the second-half of the month, setting the stage for an interesting backdrop around the 2022 open.
The bull flag that took almost seven months to build last year finally gave way in the second week of trade this year. Buyers posed a breakout on Tuesday and, so far, that theme only continues to push as prices in the pair are now trading at a fresh two-month-high in GBP/USD.
GBP/USD Daily Price Chart
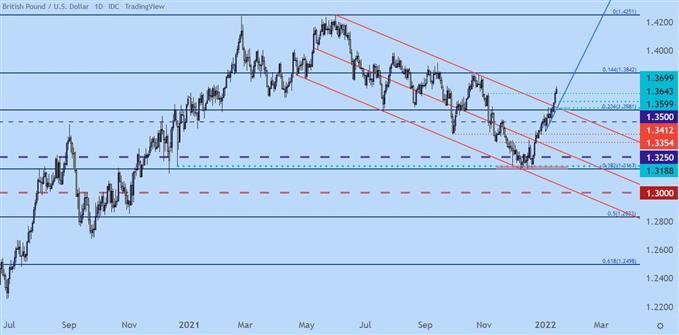
Chart prepared by James Stanley; GBPUSD on Tradingview
At this stage, the pair is overbought on the daily chart and chasing could be problematic. From the four-hour chart below, I’ve identified three areas of possible support, the most aggressive of which plots around the 1.3700 level. The 1.3581 Fibonacci level remains of interest as this helped to slow the advance, and this remains an area of prior resistance that may be re-purposed as support. In between those two prices is a quick swing-high around 1.3643 that can remain of interest for short-term strategies.
GBP/USD Four-Hour Price Chart
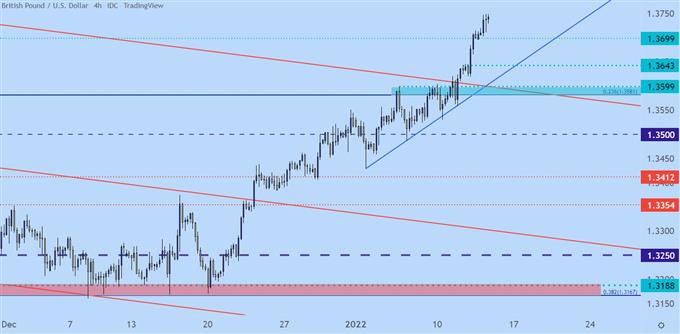
Chart prepared by James Stanley; GBPUSD on Tradingview
GBP/JPY: Falling Wedge Break, Support Test
Also of interest with the bullish GBP theme is GBP/JPY. Given the recent push-lower in USD/JPY, this has created a bit of divergence between GBP/USD and GBP/JPY.
GBP/USD is flying higher at the moment as US Dollar weakness has taken-hold after yesterday’s CPI report. But – this may be a short-term move, especially given the expectation for the Fed to be really hawkish this year with as many as four rate hikes.
There’s a key BoJ meeting on the calendar for next week. With all of the change that we’ve been seeing across global central banks of recent, might the Bank of Japan be nearing a more hawkish shift, as well? There’s scant evidence to suggest as such just yet but it seems the simple proposition has been enough to give Yen-bears question.
In GBP/JPY, this has amounted to a bit of resistance after a recent breakout. GBP/JPY had built a falling wedge very near the five-year-high that was set last October. As looked at in the Tuesday webinar, this wedge also took on the appearance of a bull flag, given how it came is a corrective move following a strong bullish push.
Prices broke out of that formation on Tuesday but they couldn’t get very far, as buyers pulled back ahead of a re-test of the swing-high from a week prior.
GBP/JPY Four-Hour Price Chart
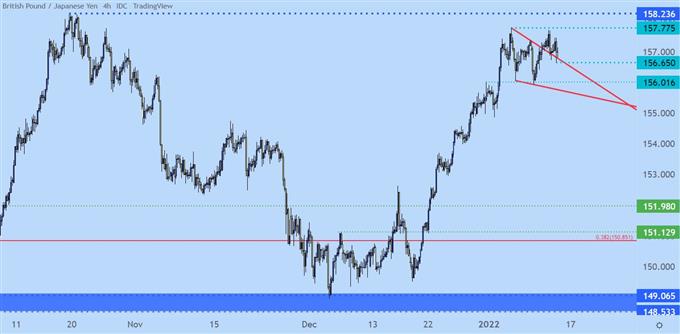
Chart prepared by James Stanley; GBPJPY on Tradingview
Since then, there’s been a build of support at prior wedge resistance and that can keep the door open for bullish continuation. But – traders are going to want to be cautious of invalidation, and there’s supports at 156.65 and 156.02 that can be used for such.
On the resistance side of the coin, there’s quite a bit sitting ahead. The 2020 swing high from last week is at 157.78, and the five-year-high from last October is just above at 158.24. Beyond that is a Fibonacci level at 159.44 and then the major psychological level of 160.00, which hasn’t been traded at since Brexit came into the equation in June of 2016.
GBP/JPY Weekly Price Chart
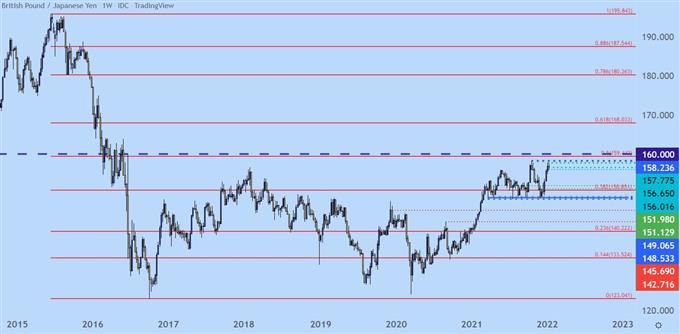
Chart prepared by James Stanley; GBPJPY on Tradingview
--- Written by James Stanley, Senior Strategist for DailyFX.com
Contact and follow James on Twitter: @JStanleyFX


